Pan Region Analysis
One of rakaia's defining features is the ability to query and parse through multiple ROIs within a session. Pan region analysis can be performed either strictly on the images themselves at the pixel level, or through object detection by quantifying/measuring and subsequently finding similar objects across regions.
Region thumbnail gallery
The Dataset gallery tab provides components for querying and rendering other ROIs in the current session that are not currently loaded into the main canvas. For example, if a user has uploaded an mcd with multiple ROIs, these ROIs can be previewed as thumbnails that can be clicked and loaded into the canvas, similar to how channel tiles can be click added to the blend. This functionality also extends to any other filetype that can be imported into rakaia: any successfully imported ROI that is not currently loaded can be rendered and previewed in the gallery.
The gallery tab provides the ability to generate a random selection of ROIs, with the user specifying the number thumbnails to generate, as well as any search criteria such as region dimension limits or query keywords that are part of either the filename or acquisition description. This is referred to as pixel-level ROI querying, as the query takes in no information about any objects or structures in the images.
Pixel level queries: random generation
The input components described above can be used to generate a randomly selected subset of ROI previews to be rendered in the gallery. Each ROI will take the channels and blend parameters of the current canvas image and apply them to other ROIs that have been imported. When generating a pixel-level query, the order of the ROIs is randomized, and will be limited to either the number of ROIs requested by the user, or th enumber of total ROIs loaded, whichever is smaller.
In the example below, a series of titration ROIs are queried, with a query keyword of 3x in the ROI name, and a minimum size of 1000 pixels:

It can be seen that the search results contain any ROIs that have dimensions of at least 1000 pixels in both the x and y-axis, and also contain the keyword 3x in the ROI name description (search queries will be a union of all search parameters).
Querying through object detection
The dataset gallery can also render ROIs based on a query using groups of segmented objects. This can be achieved by importing/generating and visualizing quantification results for one or more ROIs in the quantification tab (see this article) for more information on the required inputs for measuring/quantification.
From the quantification tab, the interactive UMAP can be subset through user-defined zoom dragging on clustered objects. If these objects have matching ROIs that in turn also have matched segmentation masks in session, the objects can be rendered in the dataset gallery.
Note: For a successful ROI query based on object detection, the matching mask must be imported and aligned to the ROI descriptor; without this, rakaia will not be able to identify where segmented objects lie within a region.
In the example below, we import a series of ROIs that have matched object quantification and segmentation masks. Using the UMAP component in the quantification tab, we can select a subset of PanCK positive cells based on the gene expression project over the UMAP, and select the Show selection in dataset gallery button to transfer the selected objects to the ROI query tab. rakaia will then render thumbnails of any ROIs that contain at least one object that was sent to query. In this manner, users can quickly observe spatial patterns across multiple ROIs for objects of similar expression profiles:
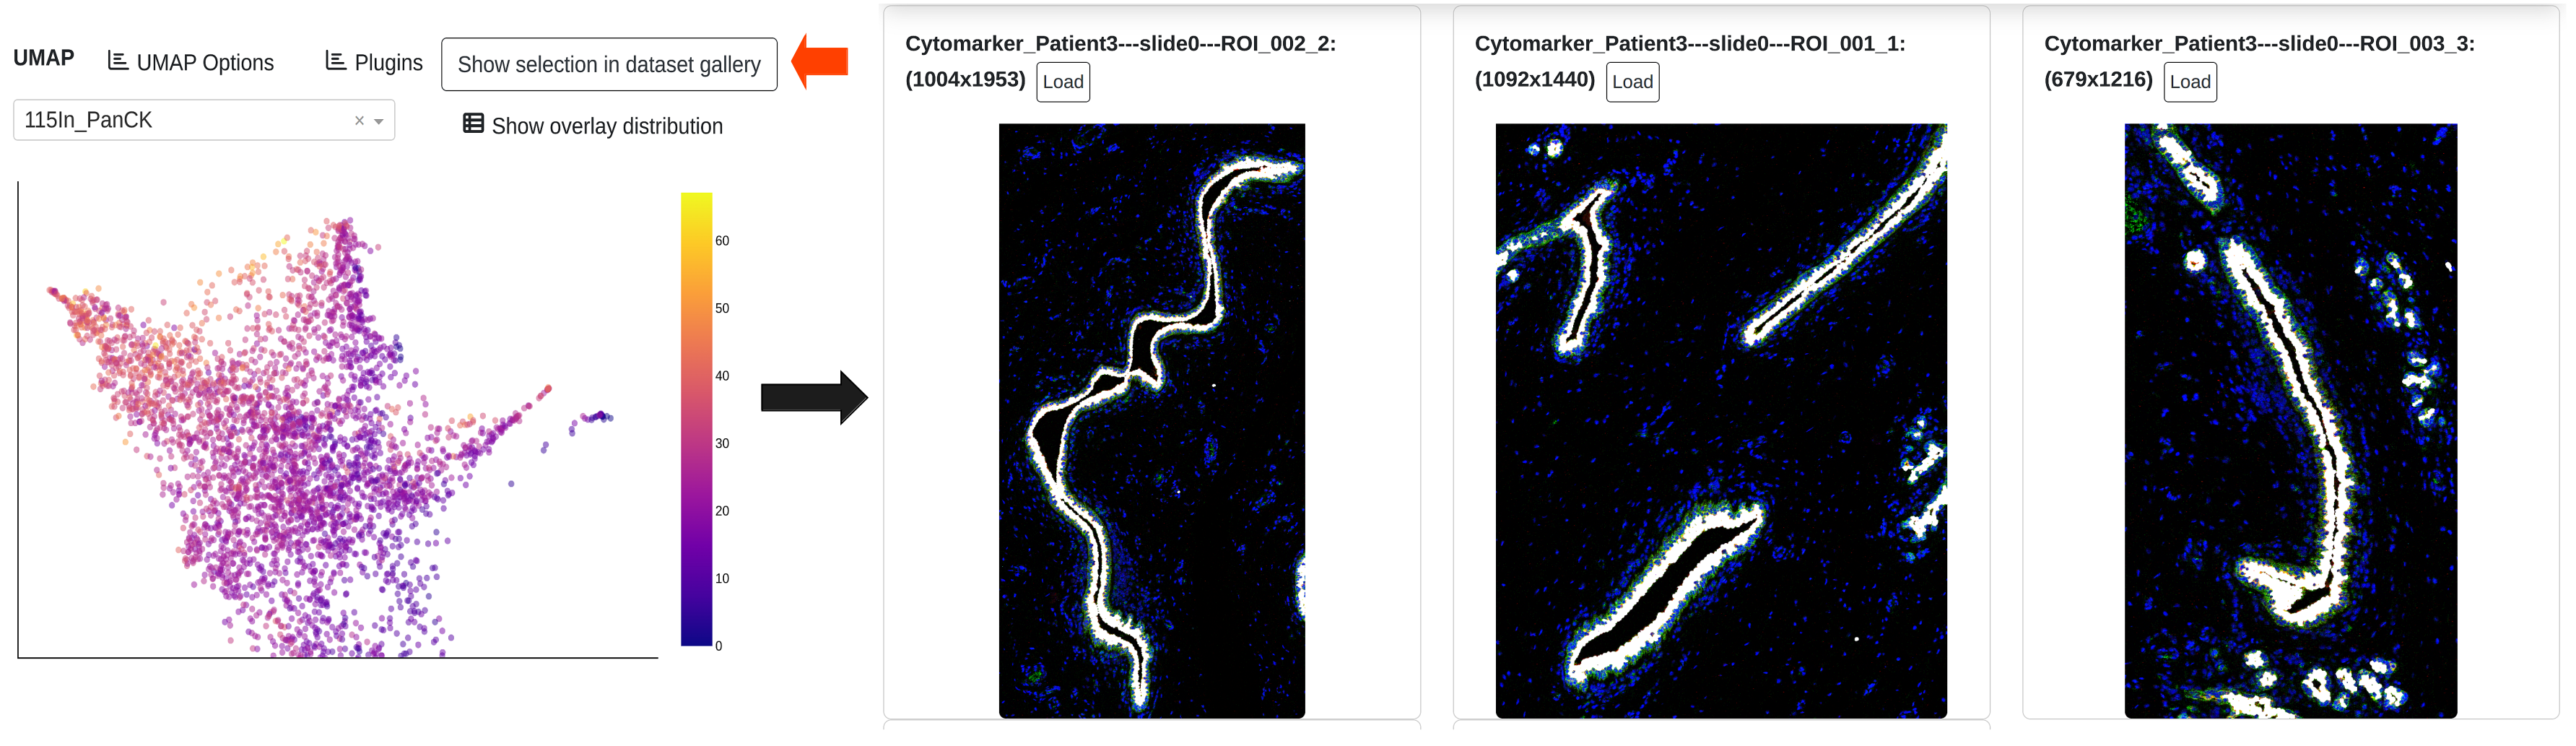
In each ROI, the objects that are part of the query will be rendered in white over the ROI blend, to indicate spatial distribution to the user. The ROIs are ordered in descending order based on the number of query objects, with the first ROI having the greatest number of objects from the query. The number of ROIs returned is only limited by the object list; if an ROI has at least obe object in the query set, it will be rendered for preview.
Exporting ROI gallery tiles
Similar to the channel gallery, thumbnails of ROIs generated through either of the methods above can be exported in HTML format using the import/export side tab (Import/Export -> Export -> Channel gallery tiles (HTML))