Measuring & Detecting
In addition to the projection of segmentation masks over blended canvas images, rakaia provides a host of tools that can analyze and visualize the quantification of objects across ROIs.
Quantification
Objects such as cells within a mask can be quantified, either in-browser or externally, to provide a per-object summary of expression statistics for each biomarker, as well as additional object parameters such as coordinates, area, etc. These results can be held in tabular CSV formats and imported for visualization and annotation. Many imaging workflows will compute either the mean or median biomarker signal for every channel for every object in a mask, and save the statistics with an ROI identifier in tidy format; in this way, multiple ROI expression profiles can be imported into one session and analyzed together.
Quantification configuration
rakaia provides in-browser quantification of the current ROI. Users may select quantification under Configure, annotate, measure, and more -> Measure/cluster -> Quantify current ROI, which will produce a pop-up modal listing the session biomarkers and provide a checklist of markers to be quantified. Quantification requires canvas with at least one biomarker applied, as well as a mask applied to the canvas so that the application can verify the compatibility of the mask prior to computation:
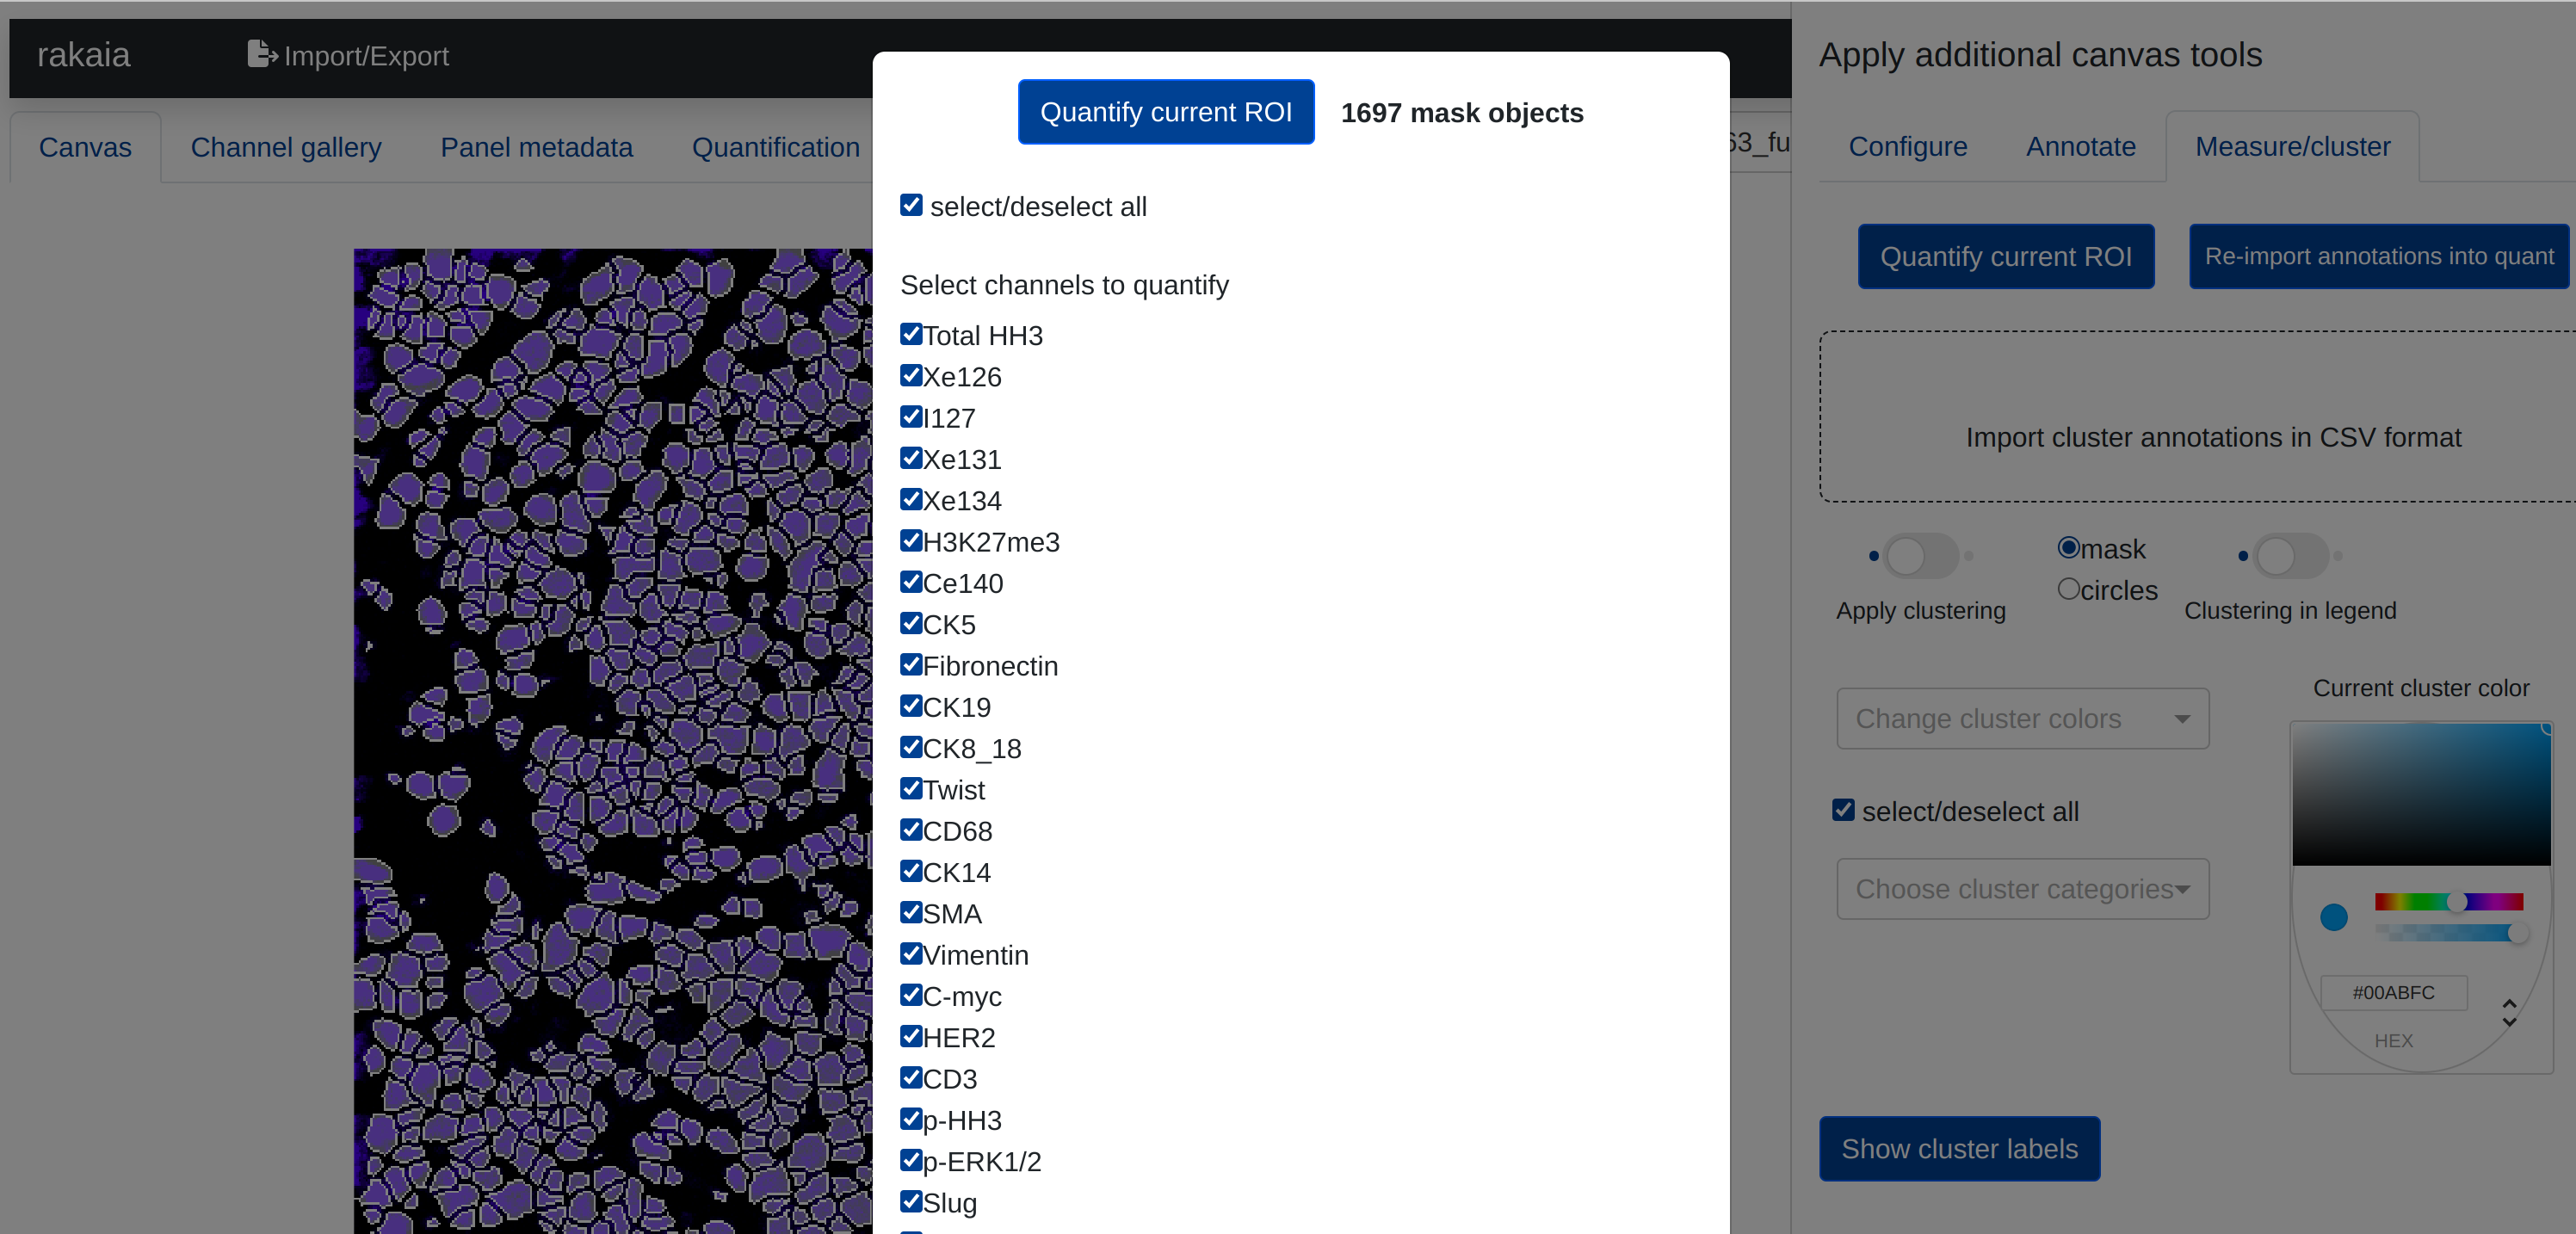
rakaia will also display the number of measurable objects in the mask currently applied to the canvas.
The computation time for individual ROI quantifications will vary significantly depending on deployment architecture as well as the number of objects and channels requested. generally, the computation time will grow linearly as the number of channels to be quantified increases, so larger datasets (> 30 channels) will likely take between 45 seconds to a minute for approximately 1000 objects.
Expression summary & dimension reduction
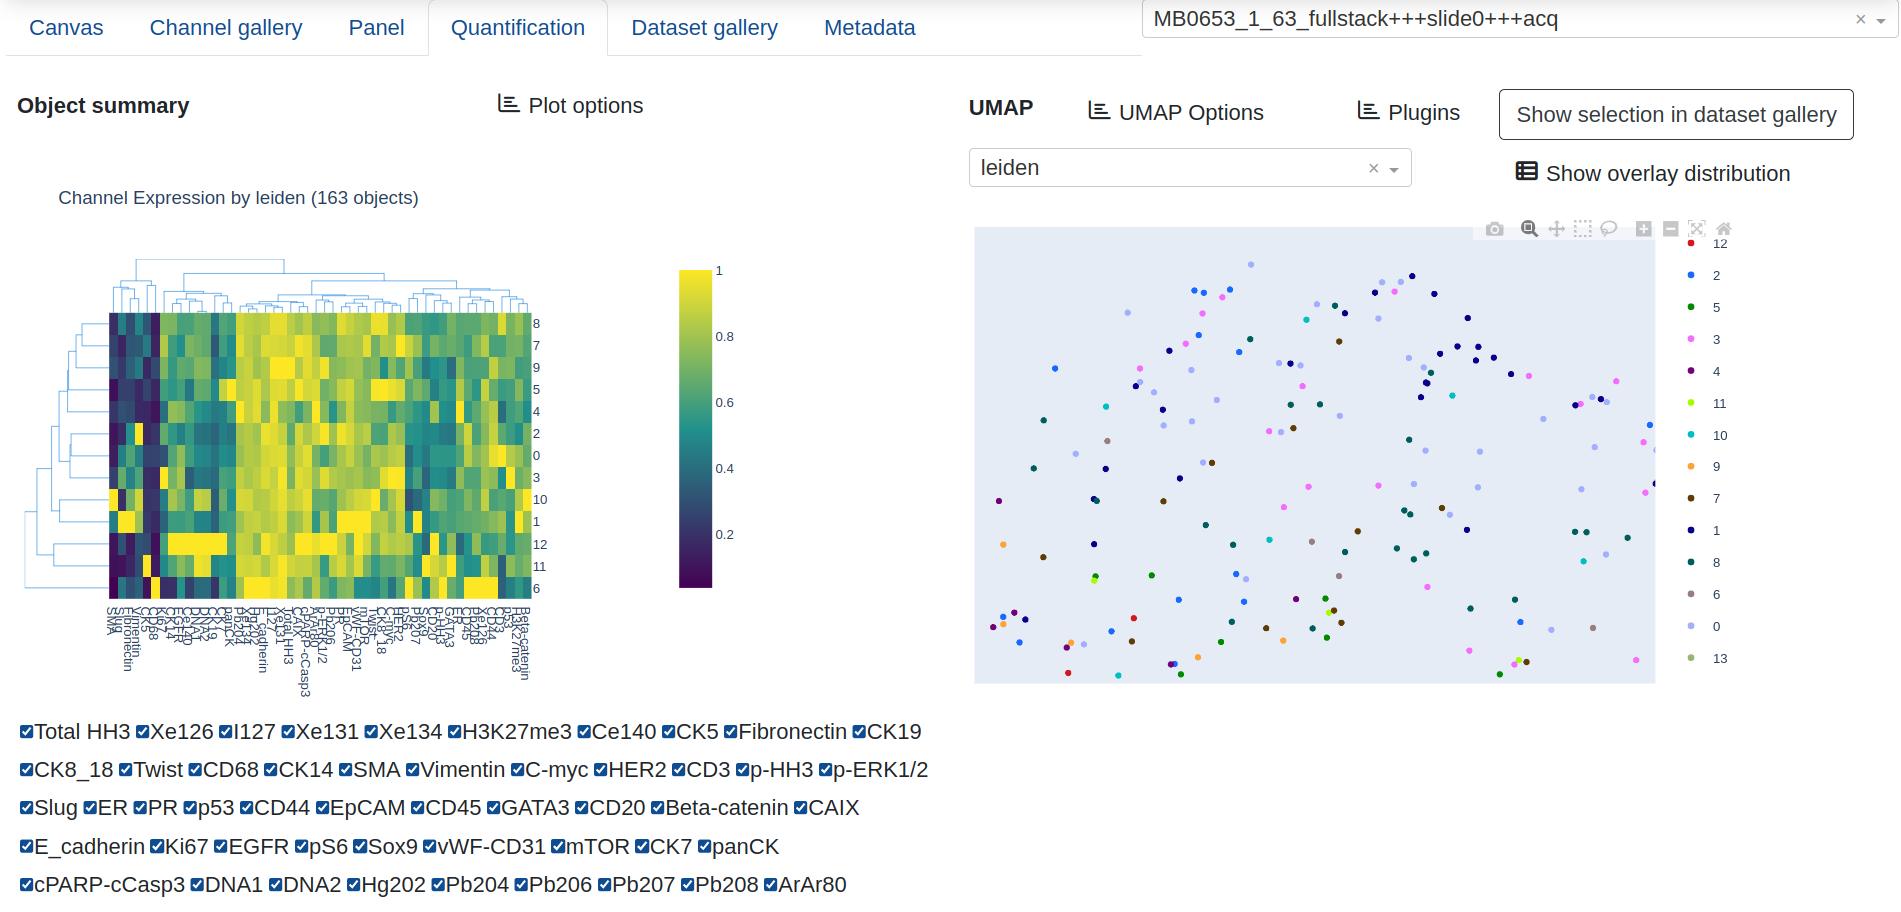
The Quantification tab provides a figure of summarized channel expression values, either column normalized along 0-1 (default) or given as raw expression counts, as well as a UMAP projection of the current quantification results. The channel expression summary will appear as two different figures: A bar chart with mean expression per marker if the UMAP overlay is numeric, or a clustergram if the overlay is categorical, with mean expression computed per categorical group and the dedrogram reflecting the similarity among the categories and markers.
The UMAP provides a dropdown list of expression and annotation values that can be projected into the UMAP graph for cluster analysis. This includes summary expression statistics for any of the biomarkers that have been quantified, as well as annotations that have been created from the canvas:
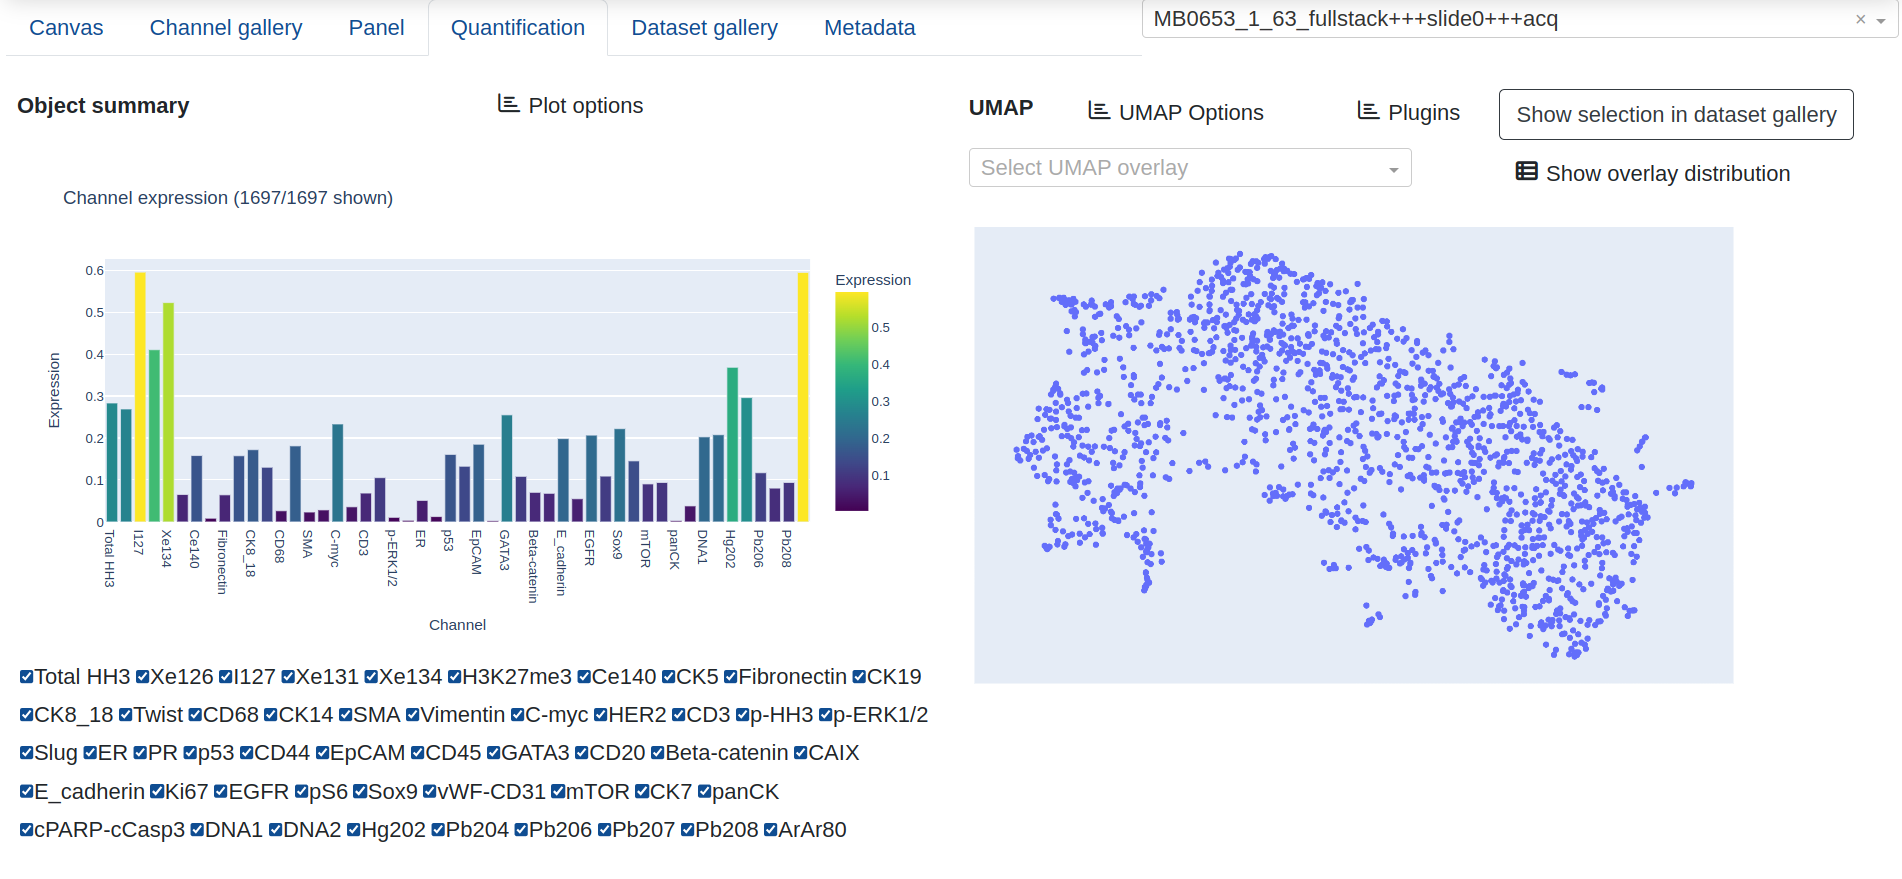
Interactively zooming in on the UMAP layout will automatically trigger the channel expression summary to update with only the objects in the current view, and Show distribution gives a frequency count of the objects in the various categories for the current UMAP projection.
UMAP configuration options
Under File Import -> Show/hide additional imports -> UMAP coordinates, users may upload a custom set of UMAP projections for the quantified objects, in order to eliminate the need to run the UMAP algorithm in the browser (which can be slow for large datasets and prone to browser timeouts). Additionally, users may also annotate the objects in the current view by creating new or using existing annotation categories and providing an annotation type (such as a object type or descriptive designation). The UMAP window must be zoomed in on a subset of objects for annotation to take place. The xy UMAP coordinates for the current UMAP graph can also be downloaded in CSV format.
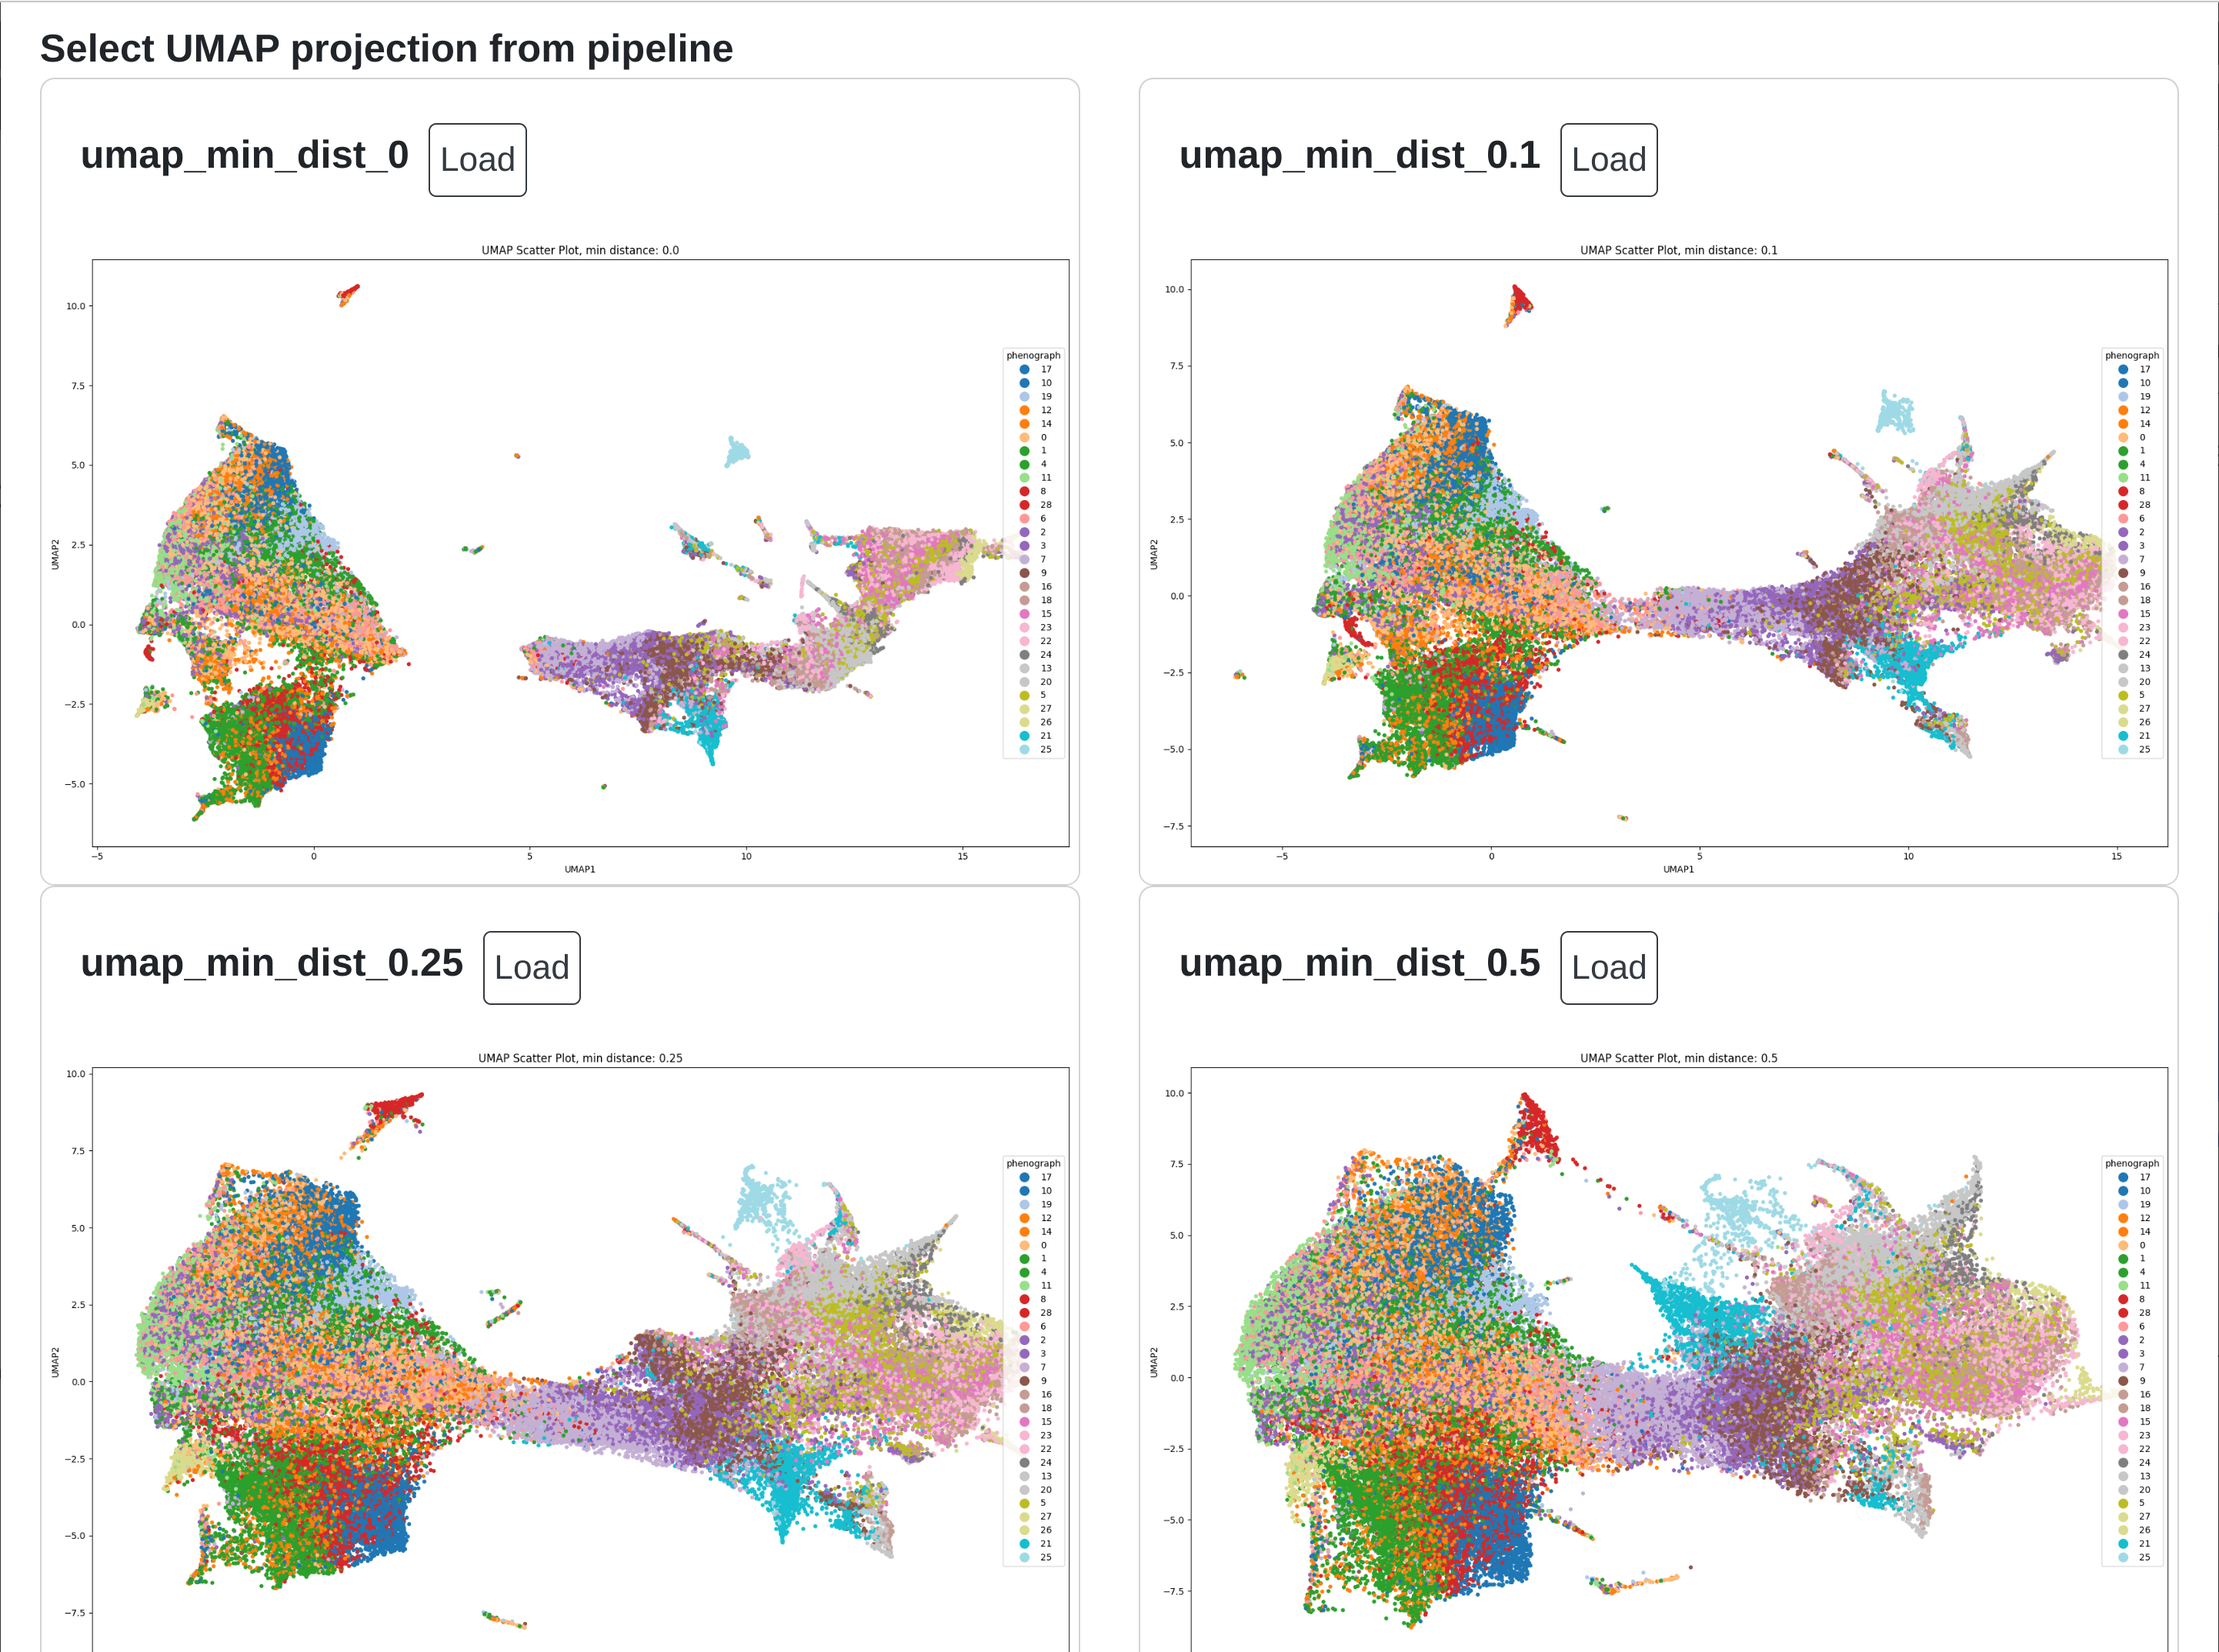
Within rakaia, users may specify certain run parameters for the UMAP using UMAP Options. This includes specifying the min distance metric to use (a value between 0 and 1), with smaller values creating more numerous and tightly grouped clusters, with values closer to 1 producing fewer clusters that are larger and more homogenously blended.
with rakaia v0.22.0, users can directly read an output directly from our snakemake steinbock pipeline v0.0.4 or greater to directly import all pipeline outputs from raw IMC data. This includes several options for UMAP projections run with different UMAP min distance metrics. These options are rendered as a UMAP gallery that the user may select, under UMAP options -> Load UMAP gallery from pipeline:
Object gating
rakaia provides different methods for identifying mask objects that are sptially resolved within a canvas image. Gating can be achieved using either quantified parameters or custom ID lists.
Using quantification
Masks applied to the canvas can be gated on the expression of one or more biomarkers or parameters when compatible quantification results exist for the current mask. Under Configure, annotate, measure, and more -> Configuration -> Gating, users may select multiple gating parameters and apply them to the mask:
The parameters to be included in the current gate can be set under Set gating categories, and the gating threshold for individual biomarkers can be adjusted by selecting the relevant biomarker and changing the range slider values under Modify gating parameters. All gating parameters are min-max normalized within the quantification results between 0-1, and gating parameters represent a normalized range of expression. Users may apply the gate as either the union of all ranges (objects that are in any of the gating parameters) or the intersection (objects that are present in all of the gating parameters).
The actual range values for each gating parameter are set globally by the min-max percentiles; that is, the percentiles consider all quantified ROIs, not just the range of the current ROI. This becomes useful when applying the gating parameters to all ROIs (see below)
If users have identified object populations of interest, the objects may be annotated directly under Annotate gating selection (current ROI only) with the specified annotation category and type, similar to other annotations. These annotations can then be applied to the UMAP layout, or exported in CSV format with the object ids listed for each annotation grouping. Note that this annotation applies only to the current ROI; to gate objects for all ROIs, view below for information on multi-ROI gating.
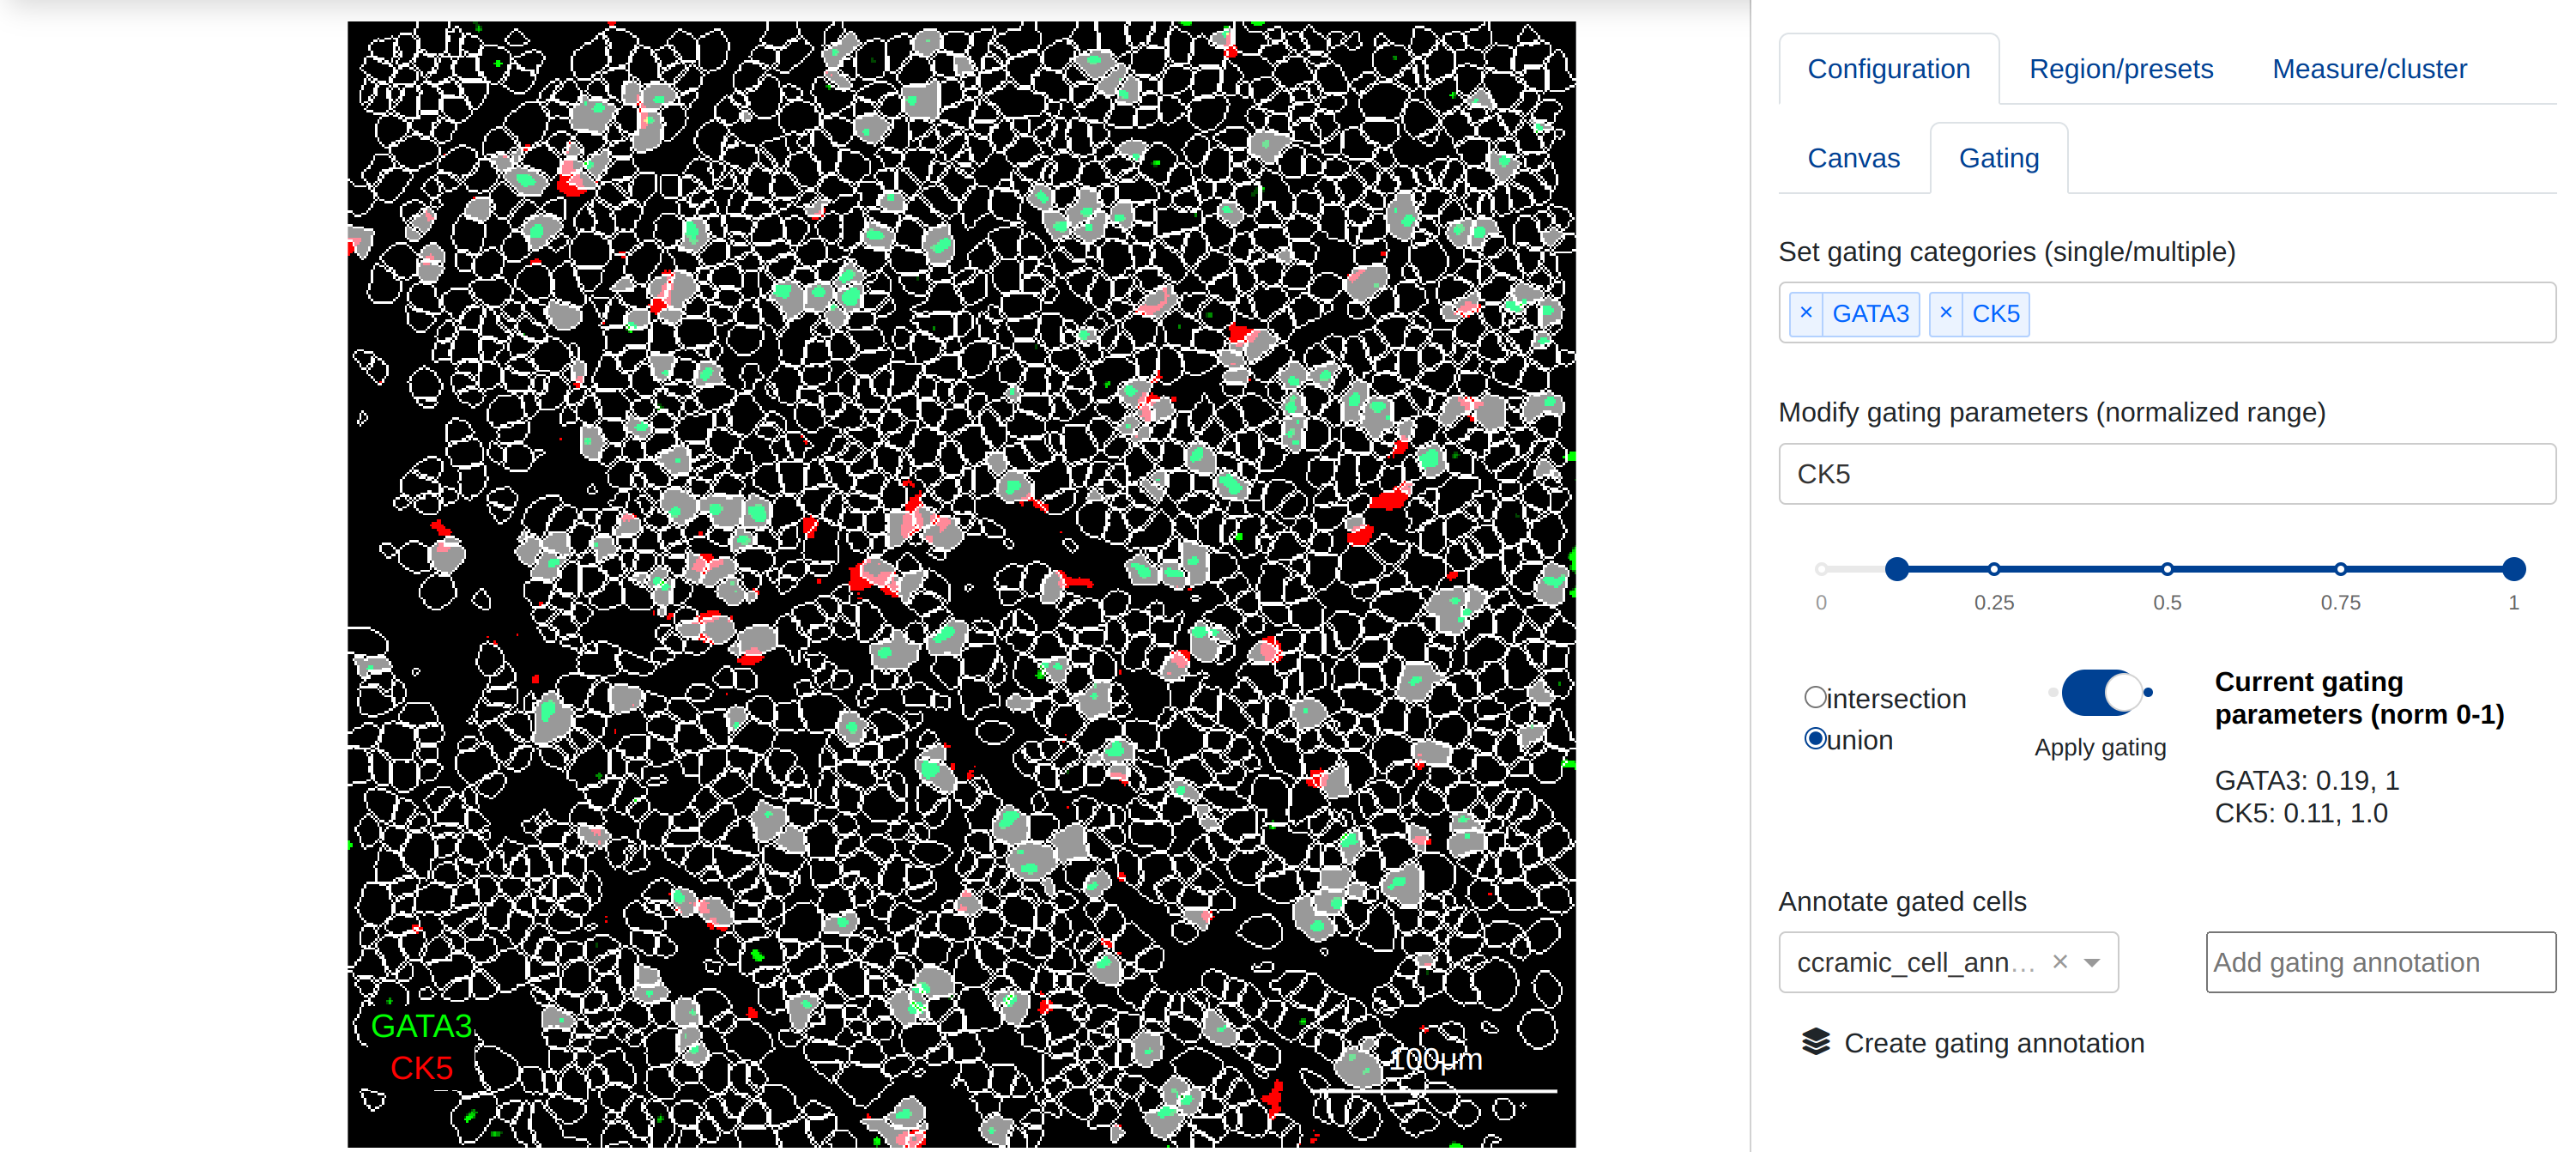
In the canvas above, objects in the mask are gated for higher expression of either GATA3 or CK5. objects not included in the gate are shown with the objet border; this can be togfled off to show just the gated objects (See Masking & Segmentation for more information)
Important: Currently, rakaia gates on the inclusion of objects within a certain threshold, but does not explicitly have a control for exclusion. If a user wishes to exclude certain objects based on a gating criteria, he/she can select the opposite range of values that specify negative expression.
For example, in the example above, the user has determined that the quantile range for CK5 positive cells to be 0.11 to 1. If instead, he user wants to find CK5 negative cells (i.e. cells that are excluded from CK5 positivity), he/she should set the range to the rest of the slider that is not covered by positive range, i.e. 0 to 0.105. This essentially provides the complement object set to the positive list, providing a ethod for excluding objects based on the normalized expression.
Important: in order to capture the ids of the objects associated with gating parameters, when a user annotates based on gating, the associated mask must be applied to the canvas, and the gating parameters toggled on so visually, the objects in the set are visible.
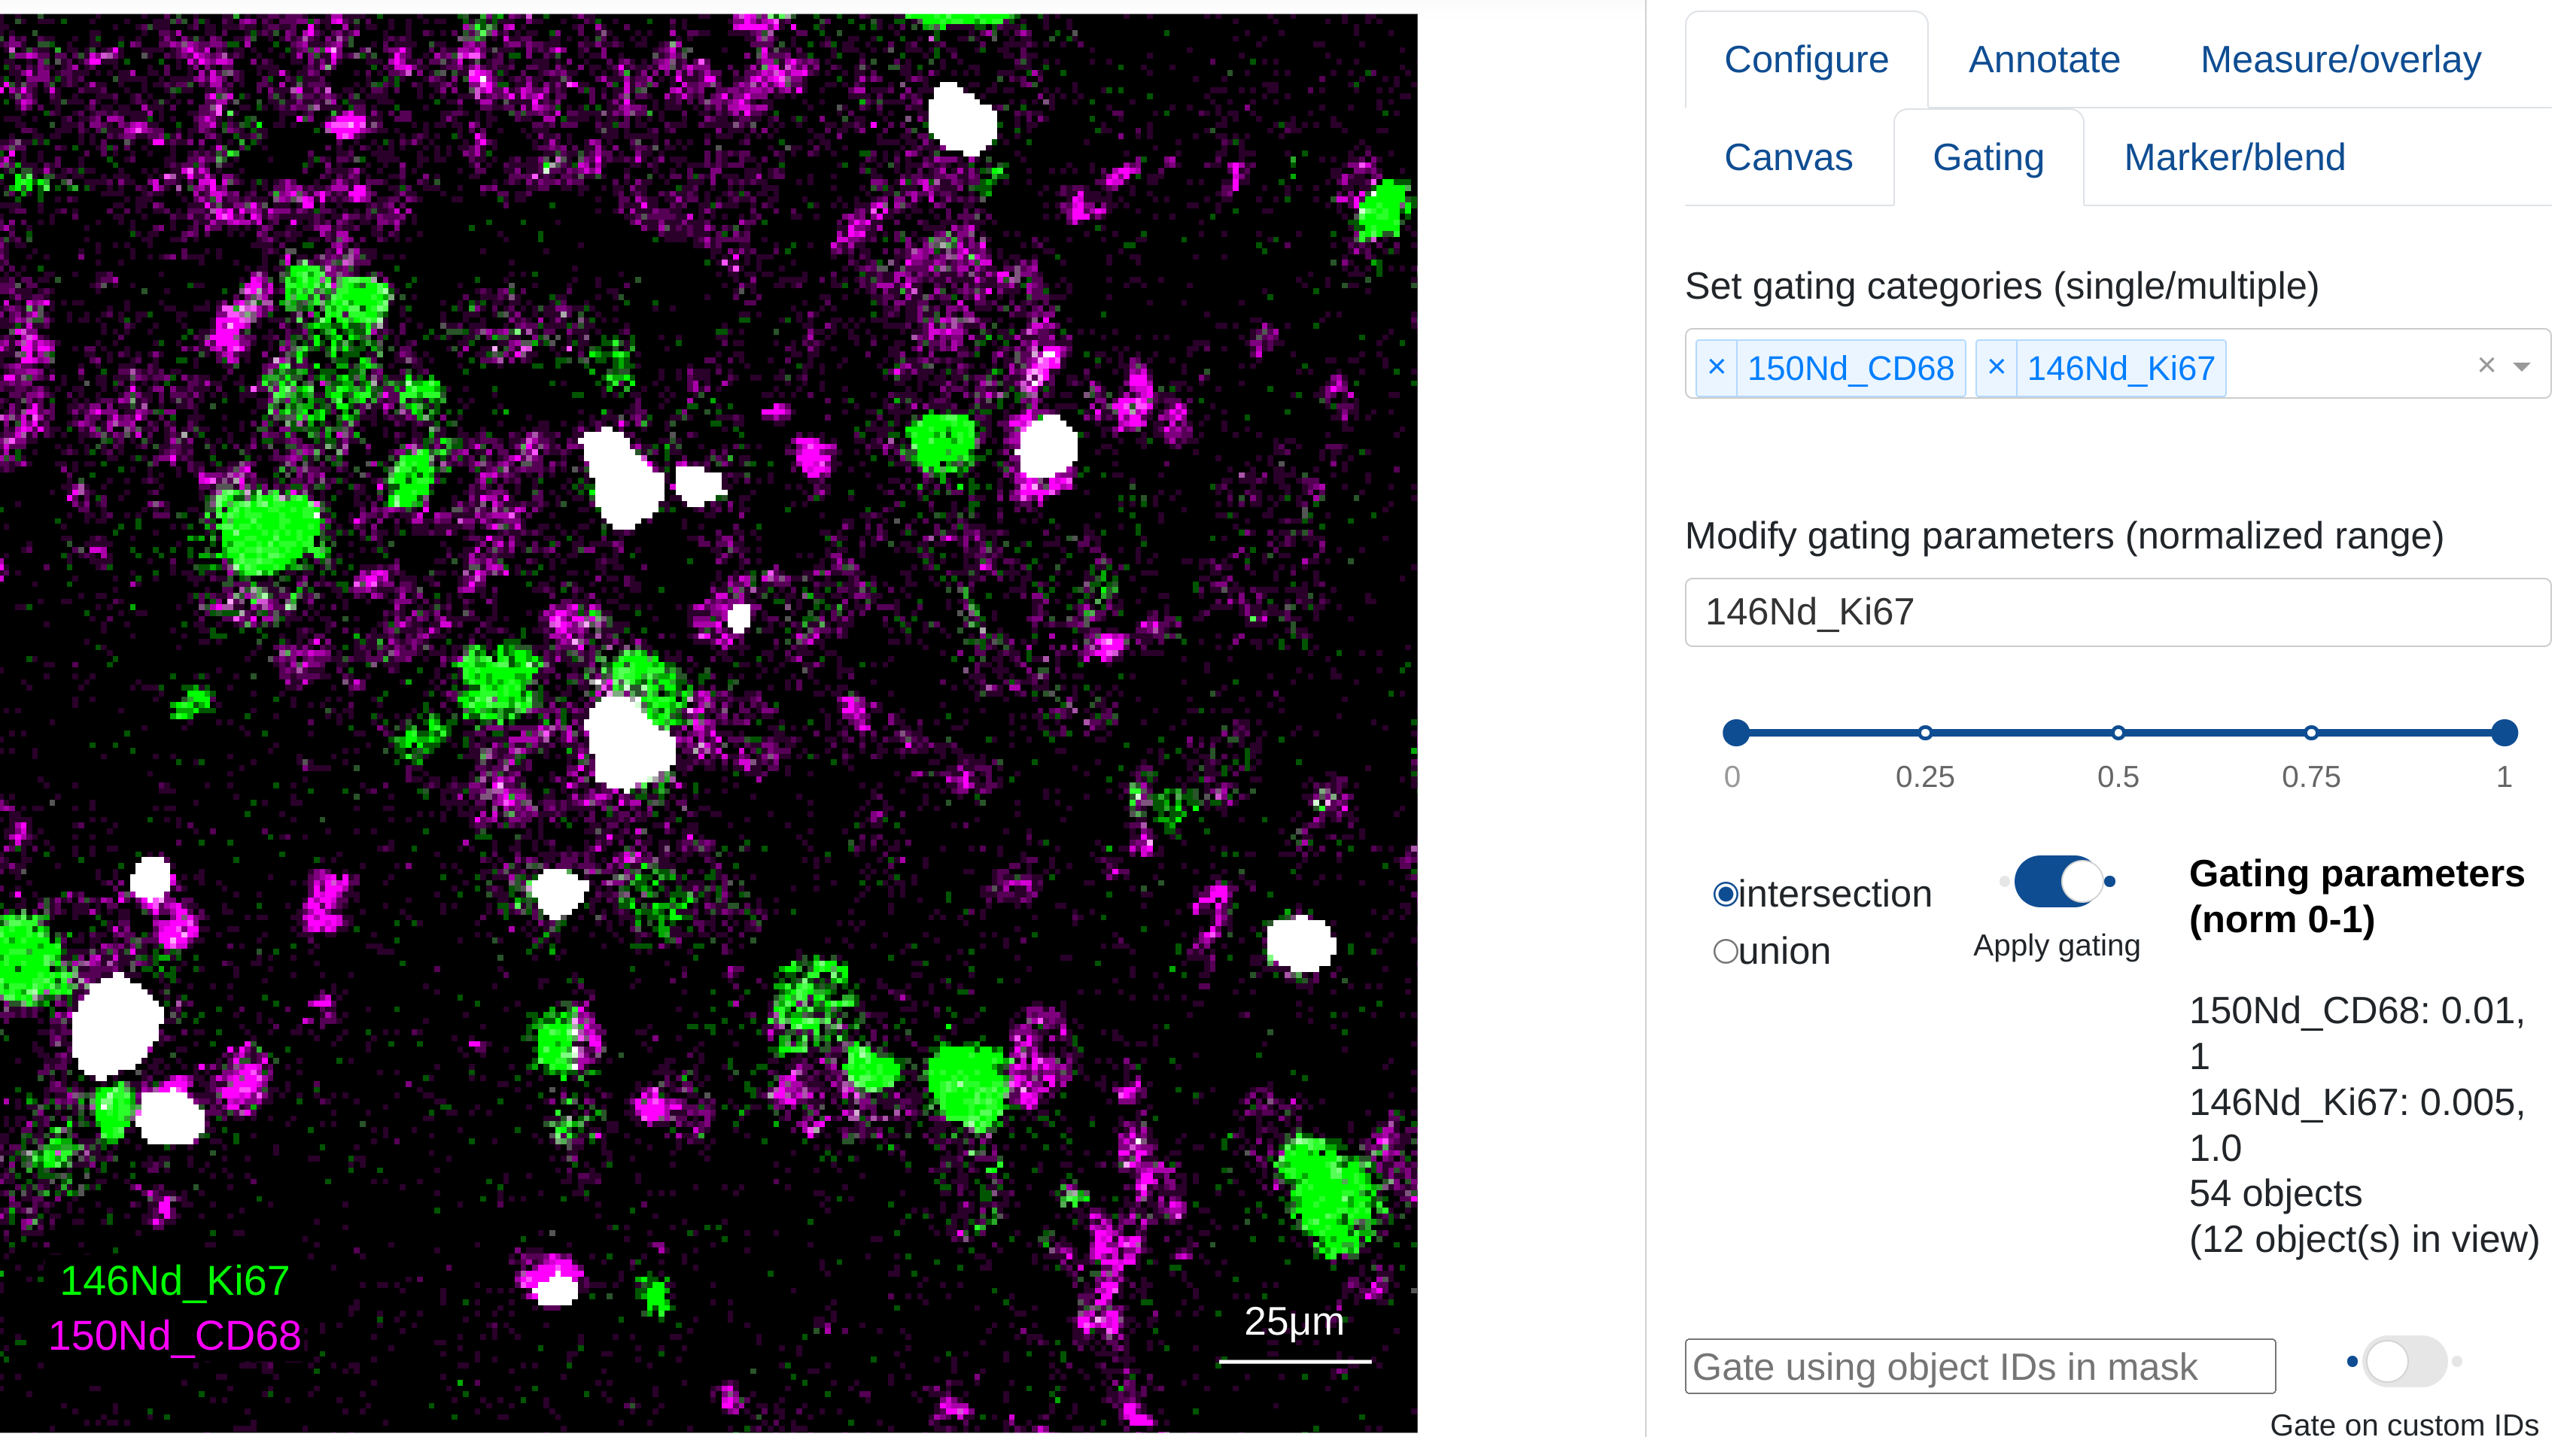
If users have zoomed in on a specific region of an ROI while gating parameters have been applied, rakaia will give a count of both the total number of objects in the current gating selection, and the number of objects in the current zoom view:
Multi ROI gating
rakaia v0.22.0 introduces the ability to apply the current gating parameters to all quantified ROIs using Annotate gating selection (all ROIs). This is useful for datasets with multiple images that have been quantified together. rakaia will use the normalized gating ranges that the user has specified for the current image and apply them to all quantified ROIs in the set. Similar to a single ROI gating annotation, the user needs to specify a gating category and gating annotation value to assign to the objects in the gating selection.
Custom gating lists
Alternatively, users may supply a string of comma separated mask IDs for gating. The mask objects with IDs that correspond to those contained within the string are shown. In the example below, the objects with mask ids 100, 200, 300, 400, and 500 are shown filled in relative to all other objects:
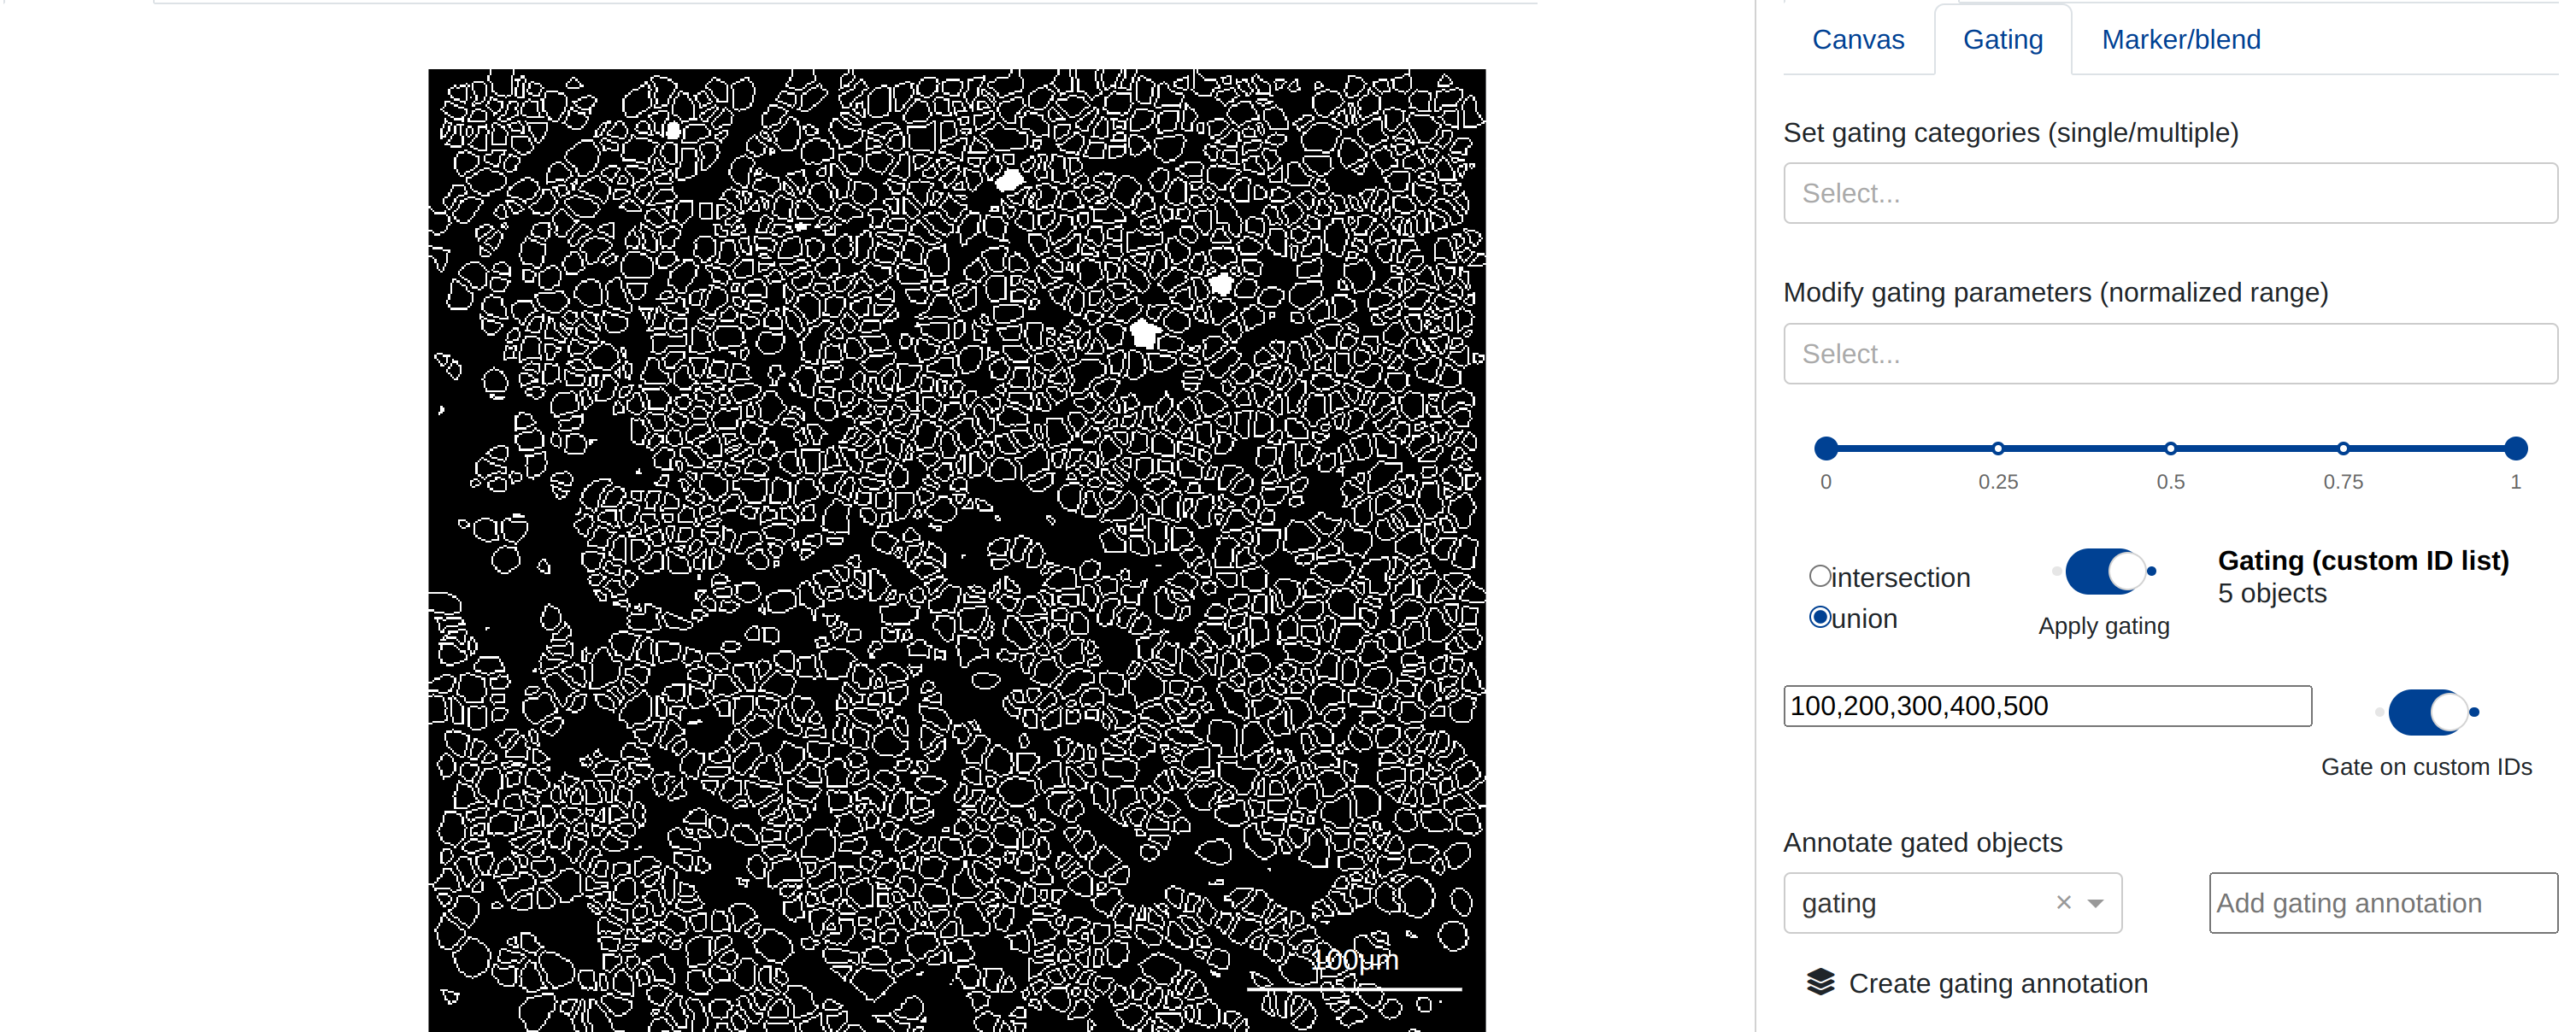
Users may toggle the Gate on custom IDs button to switch between the two gating techniques listed above.
Annotation projection from quantification results
(Visit the section on masking for more information on how to provide cluster projections inside object masks).
rakaia allows users to transfer object annotations into cluster projection frames on a per ROI basis. From the quantification tab, any category that
is currently visualized as the UMAP overlay can be applied as a cluster projection. In the example below, a custom gating annotation of objects has been made using the gating feature, and the category and sub-categories are transferred using UMAP Options -> Current overlay -> Cluster.
![]()
![]()