Data Import and Configuration
rakaia supports a variety of data imports, which includes channel images, segmentation masks, spatial transcriptomic expression profiles, configuration files, quantification results, etc. Below is a brief list of supported file formats for the different import categories, as well as the input options for dataset import.
Data formats
Raw image files
rakaia supports the following formats for importing raw images:
- mcd
- tiff/ome.tiff (multi-channel: each page of the tiff is assumed to be a channel belonging to the same ROI)
- txt files (redundant storage files that come from mcd files)
- h5py
Raw image files should hold the images as 2-dimensional arrays in greyscale format. Conversely, certain formats will hold 3-dimensional arrays where the third dimension represents the individual greyscale channels.
For spatial datasets, the h5ad file extension is supported (See the spatial dataset article)
Data Flowchart
Use the flow chart below to select the most suitable option for data import. The final boxes are clickable and will take you to the relevant sections.
Masks
Masks should be imported as single-channel greyscale tiffs. The tiff should represent a 2-dimensional array where values are integer-based and represent different objects, starting at 1. For example, the region in a mask where values are all 1 corresponds to ab object that is identified by 1.
Masks should have matching dimensions to at least one of the imaging datasets that have been imported into the session. When a mask is selected, rakaia will verify the dimensions against the current data loaded, and will warn the user if incompatible dimensions exist. Read more under Masking
Important: masks should be generated as 32-byte dtype arrays for an appropriate processing pipeline. Failure to cast the mask with the appropriate byte size may result in the loss of mask objects that can interfere with proper quantification and object detection.
Measurements results
measurements such as summarized intensity statistics for mask objects for one or more ROIs may be imported in the following formats:
- CSV
- Anndata (h5ad)
Visit the Measuring/Detecting portion of the documentation for additional information on the specific format of quantified results that is required.
Data import components
rakaia provides two options for importing raw imaging data from file sources. Users can use either the drag and drop uploader to make a copy of imaging files in the session, or by copy and pasting either a filepath or local directory and reading the files directly from the local source.
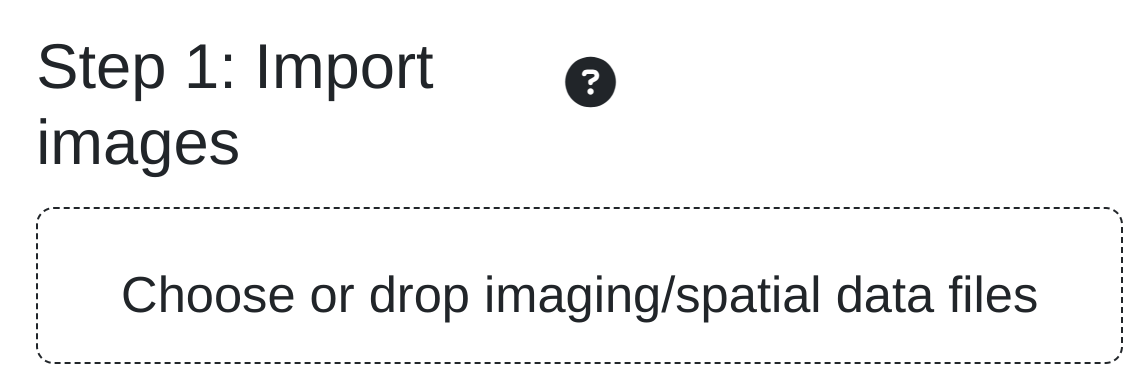
Option 1: Drag and drop uploader
rakaia enables the import of data files into the session using a Javascript-enabled drag and drop component as the topmost component in the rakaia data configuration tab:
This component uses an underlying flow.js library to copy the data into a local temporary file cache. It is important to know that this component will duplicate the data on local runs, caching the files to temporary storaage, which will be slow for large file uploads and not optimal for systems that lack a large amount of free disk space. For large files or systems without sufficient disk storage for data duplication, the local file dialog below should be used.
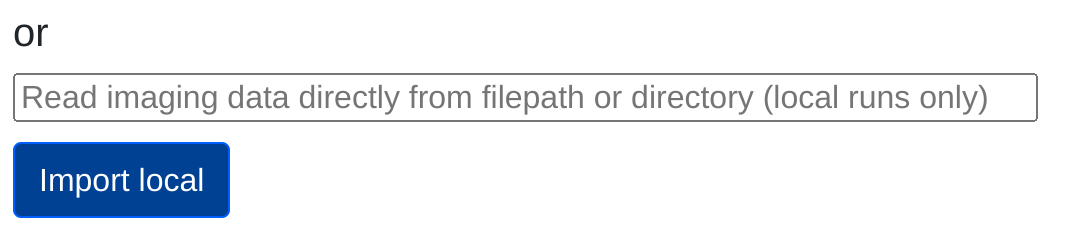
Option 2: Local file or directory dialog
Users can read data files directly from their systems on local runs using the direct file reader below the drag and drop uploader:
Users may choose to read either a copied filepath string when filepath is enabled, or read all of the compatible files in a directory when directory is selected. Note that rakaia must have access to the local hard drives from where rakaia is initiated; this is possible, for example, if the user is running a local instance from his/her computer, but it not possible when using a shared deployment accessed from a shared server.
Data loading
In rakaia sessions, the unit of analysis is the region of interest, or ROI, which corresponds to a series of channel arrays of identical dimensions that can be layered together using additive blending. These channels represent a single tissue region where imaging has occurred. Typically, each channel will represent a marker of interest measured using either florescence or imaging mass cytometry.
At any given moment, users can have a single ROI loaded into the session and the canvas, where an additive blended image can be created. Users may toggle among multiple ROIs within one session provided that the channel number/panel is identical across the ROIs. ROIs that have different channels represent different experiments, and therefore cannot be analyzed within the same session.
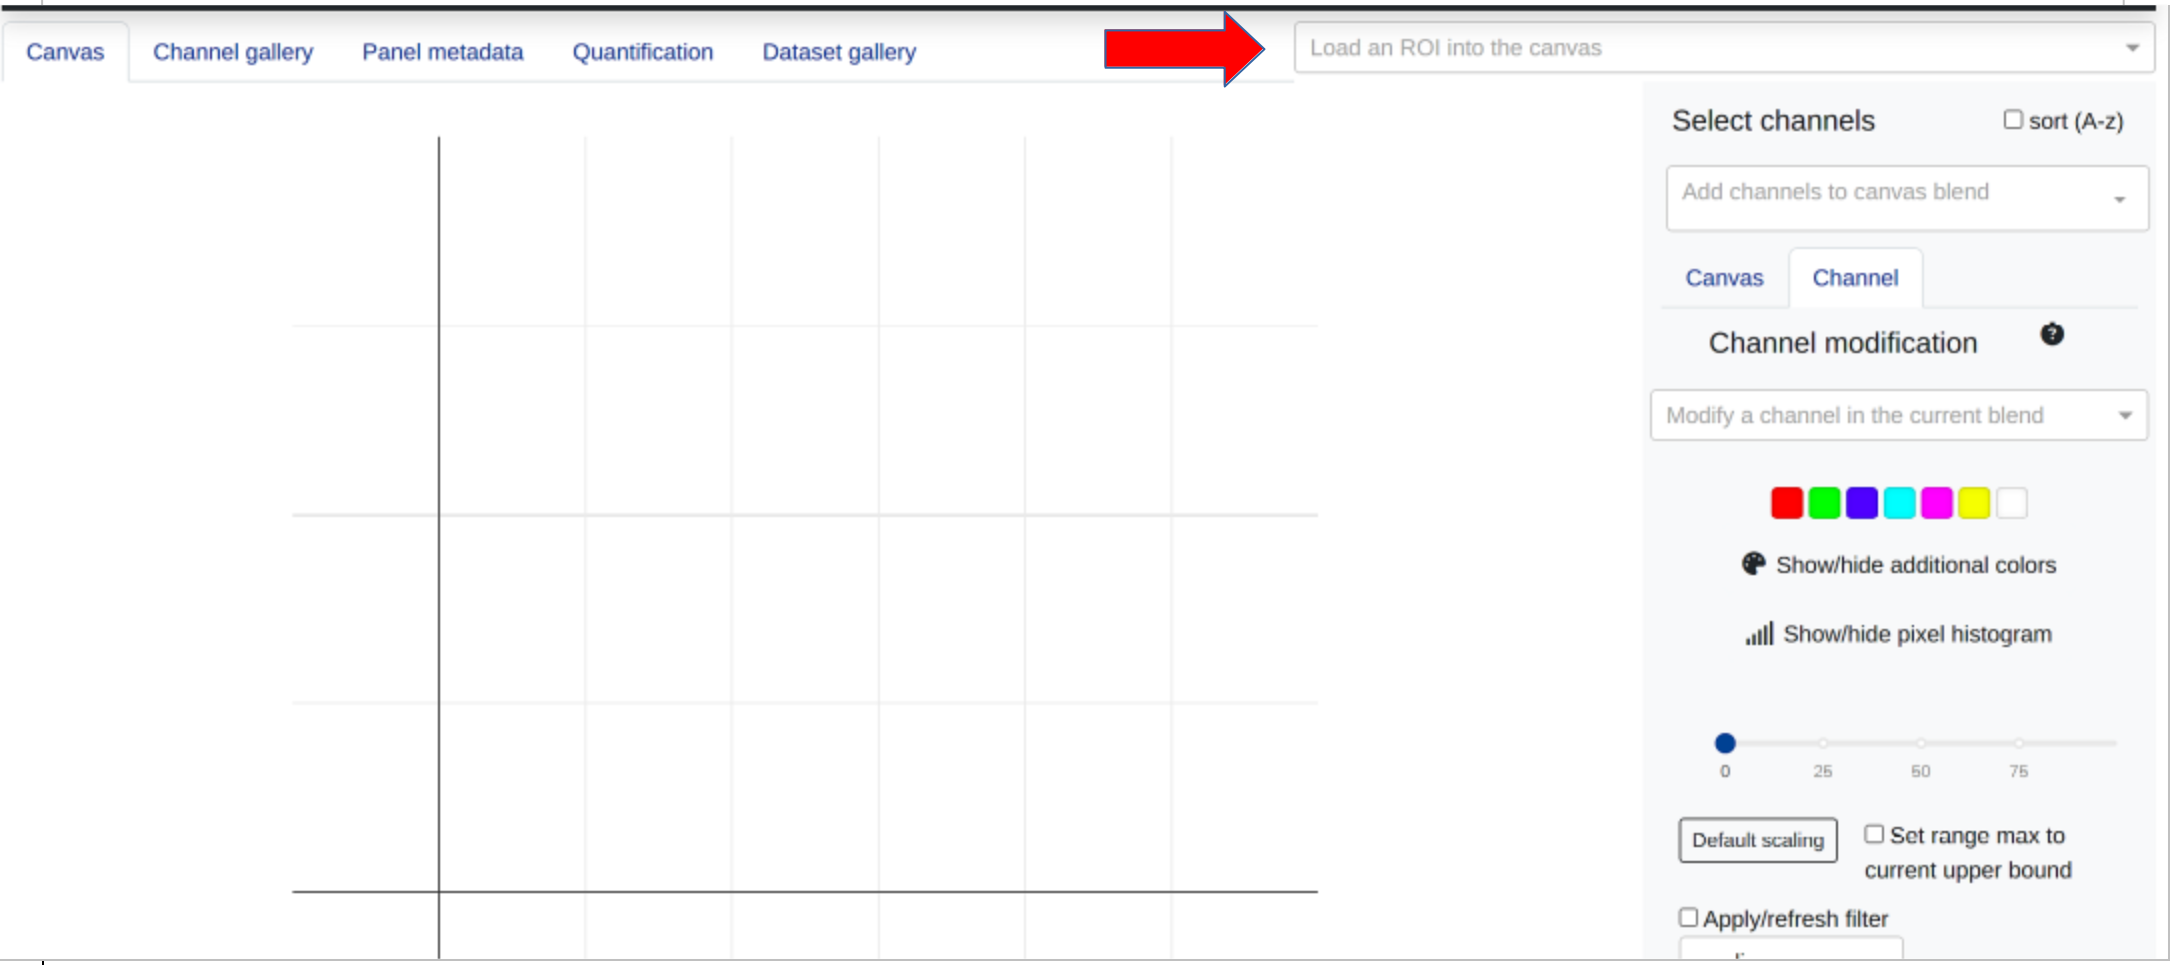
Users may view and select ROIs from the dataset information table once data have been successfully imported, or select an ROI identifier from the data collectino dropdown menu:
Once an ROI has been selected, users will be able to populate the channel tile gallery and begin to create a blended image in the main canvas.
Importing from a pipeline
rakaia supports the import of processed IMC data directly from our modified steinbock snakemake pipeline, which wraps the steinbock Python package into a parallelizable and reproducible workflow. Visit the pages above for more information on how to process raw IMC data into standardized outputs.
rakaia can either read individual pipeline outputs (masks, quantification, etc.) as individual files into the data upload components above, or can diretcly read a local filepath corresponding to the parent directory for an output run. A typical steinbock snakemake outpt directory will look as follows:
sample_run
  deepcell
    cell
    nuclei
  export
    ome
      samplerun.zarr
      samplerun.h5ad
  img
  mcd
    dataset_1.mcd
  quantification
  config.yaml
  panel.csv
  panel_deepcell.csv
Copy and pasting the full directory path to sample_run in the local file and directory dialog will allow rakaia to parse all of the outputs in the directory into a session in one go, allowing the user to have matched images, masks, and quantification results for all processed ROIs with a single click.
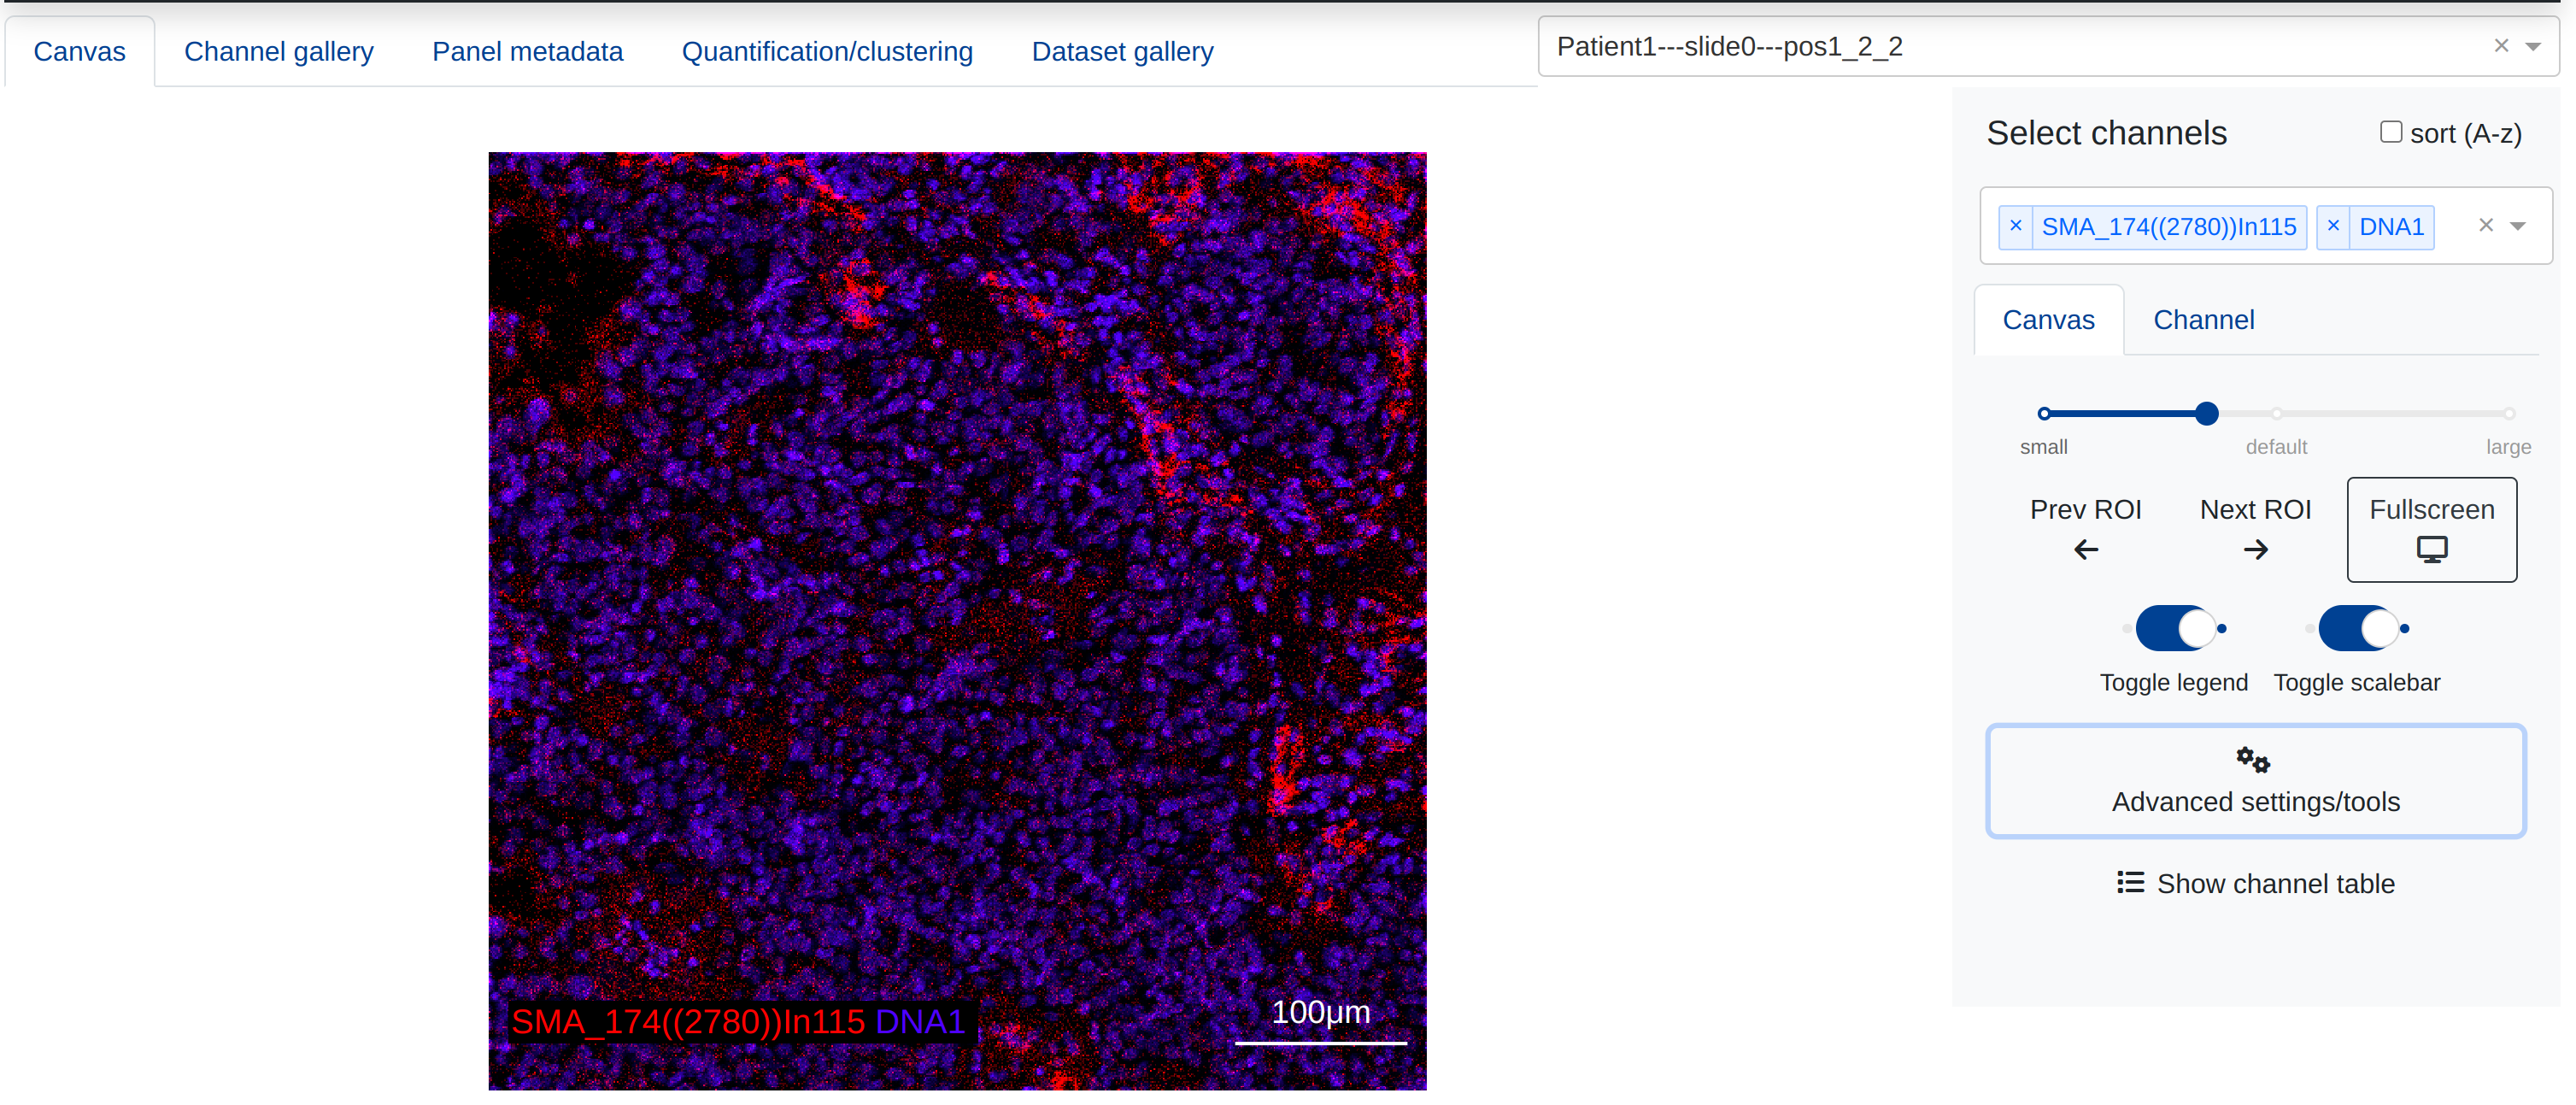
Main canvas
The main tab of rakaia contains the components required to create blended multiplexed images, the msot important of which is the main canvas. Once an ROI has been selected, users may additively blend one or more channels together by selecting channels from the Channel selection dropdown menu:
More information about creating additive blended images and performing pixel-level analysis can be found in the Pixel level analysis portion of this documentation.
Tile gallery
Adjacent to the main image anlaysis tab is the Channel gallery tab, which provides a small thumbnail preview of each channel in the current ROI:
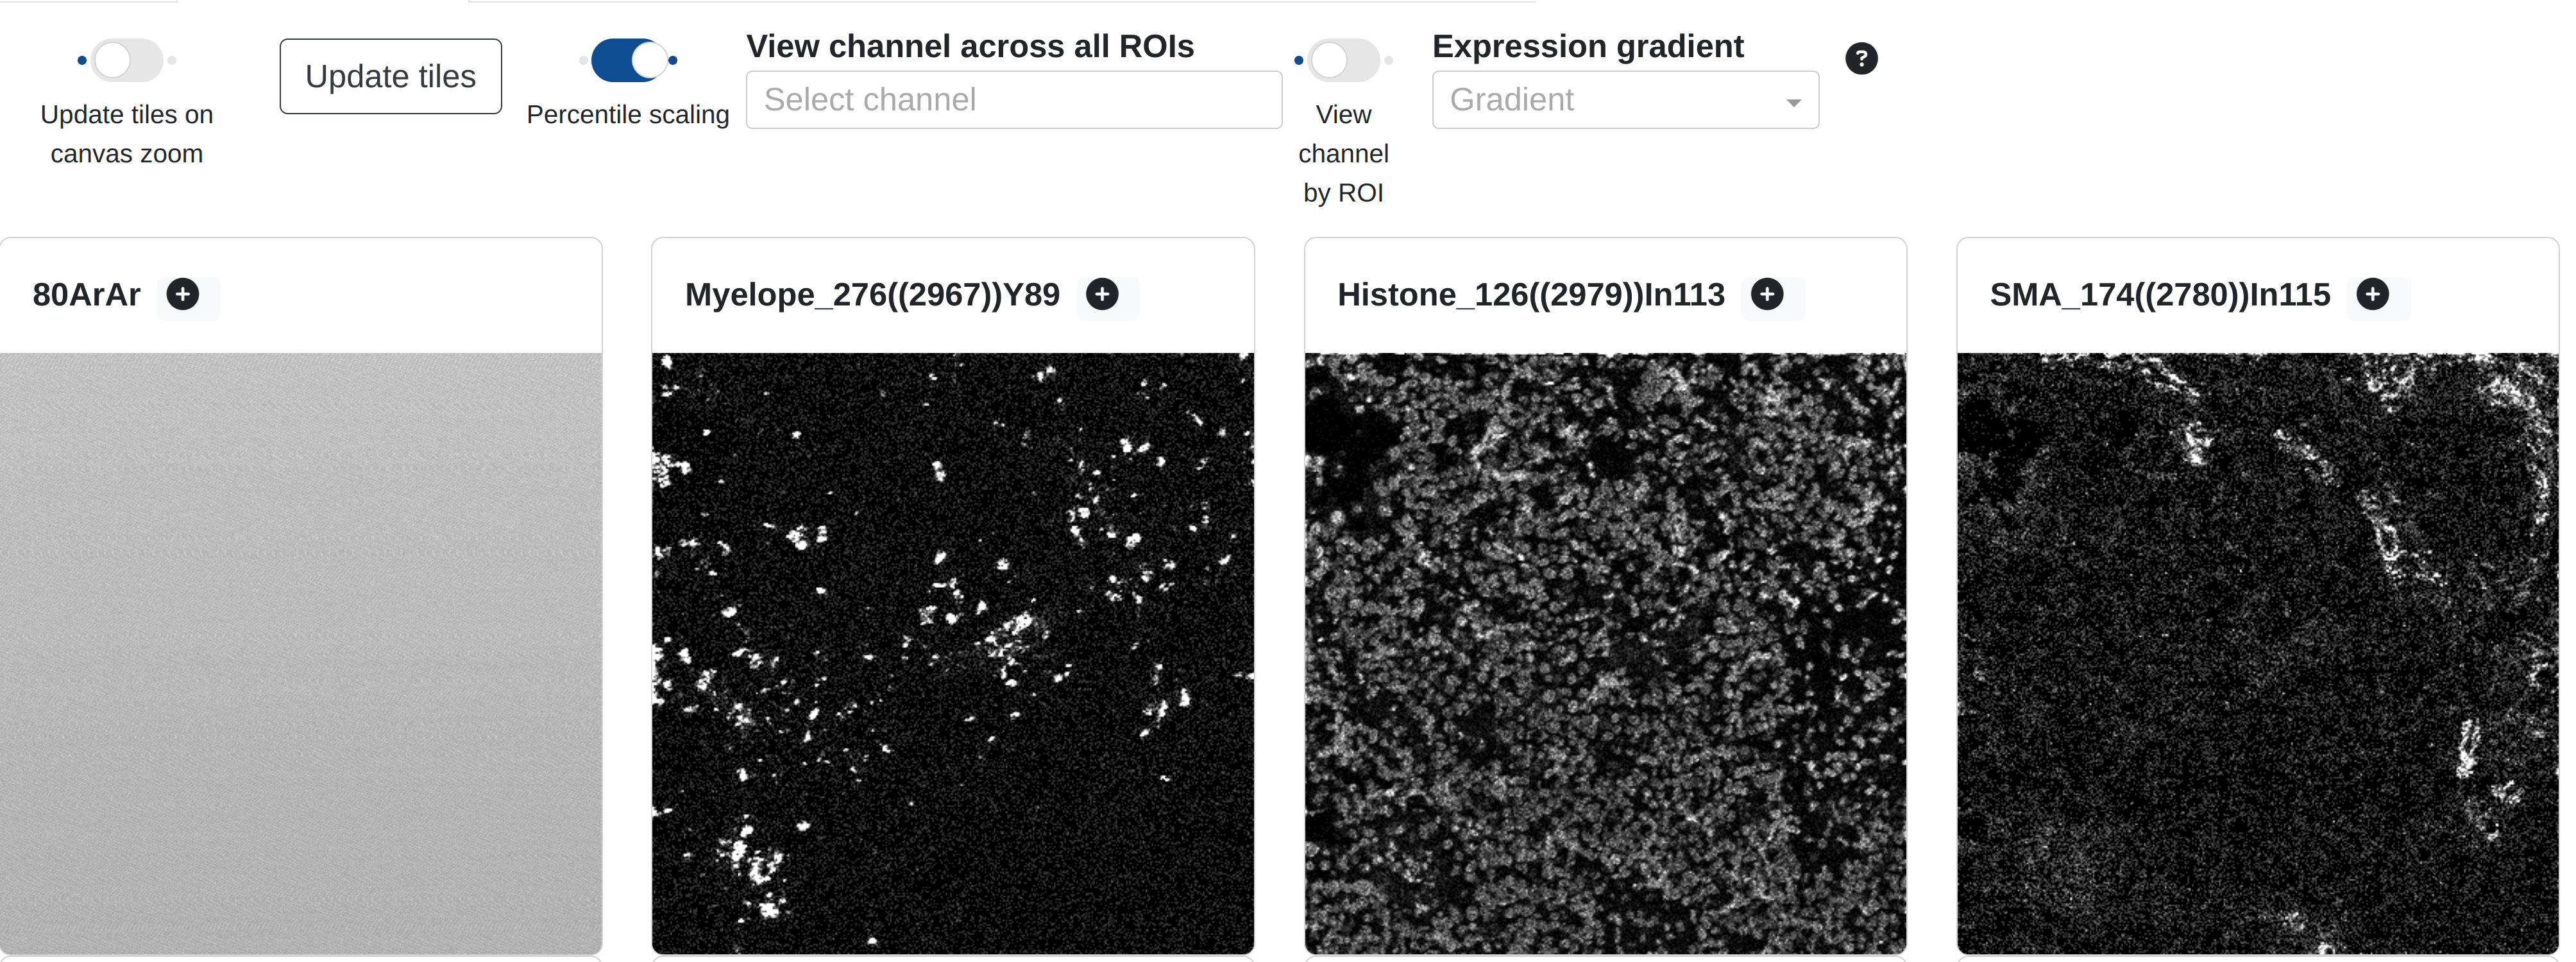
Each thumbnail is a downnsampled version of the greyscale channel image available for blending, autoscaled by percentile scaling (99%) so that a reasonable proportion of the channel signal is available by default. Users may browser and scroll this tile gallery to get a general impression of the expression patterns in each channel before adding one or more channels to the main canvas. Users may also add channels directly from the tile gallery by selecting Add to canvas for any of the channels shown. In turn this will redirect the view to the main canvas where the selected channel will be added to the blend.
By default, rakaia will attempt to render the tile canvas every time a new ROI is loaded into memory. However, for spatial datasets as well as datasets that are too large to fit into memory, the gallery isn't loaded, as the time required to load and preview all markers would take too long. In this case, rakaia will inform the user that the tile gallery was not generated.
The channel tile gallery can be exported from the import/export side tab. Users should select Import/Export -> Export -> Channel gallery tiles (HTML) to output an HTML rendering of all channel thumbnails.
Certain channel markers may appear slightly differently in the channel gallery when compared to the main canvas. This is likely due to the resolution difference between the gallery tiles and the canvas. Most of the channel tiles are downsampled to 300 pixels as a thumbnail preview in the gallery (exceptions to this are the gas channels and ROIs below a certain size), as this helps the gallery to render faster. For most channels, this downsampling doesn't introduce too much signal compression; however, for very noisy markers with a lot of background signal, the noise will appear removed in the gallery, but will appear in the canvas. This difference will be similar to applying a median filter on the canvas image.
The gallery tiles should serve only as a basic preview of the channel prior to loading, and its resolution in the canvas should be treated as the true resolution.
Tile gallery by channel
By default, the channel gallery will display a thumbnail of every marker in the current ROI. The user may alternatively toggle the view to view a specific channel across all imported ROIs, by making a selection under View channel across all ROIs and toggling View channel by ROI:
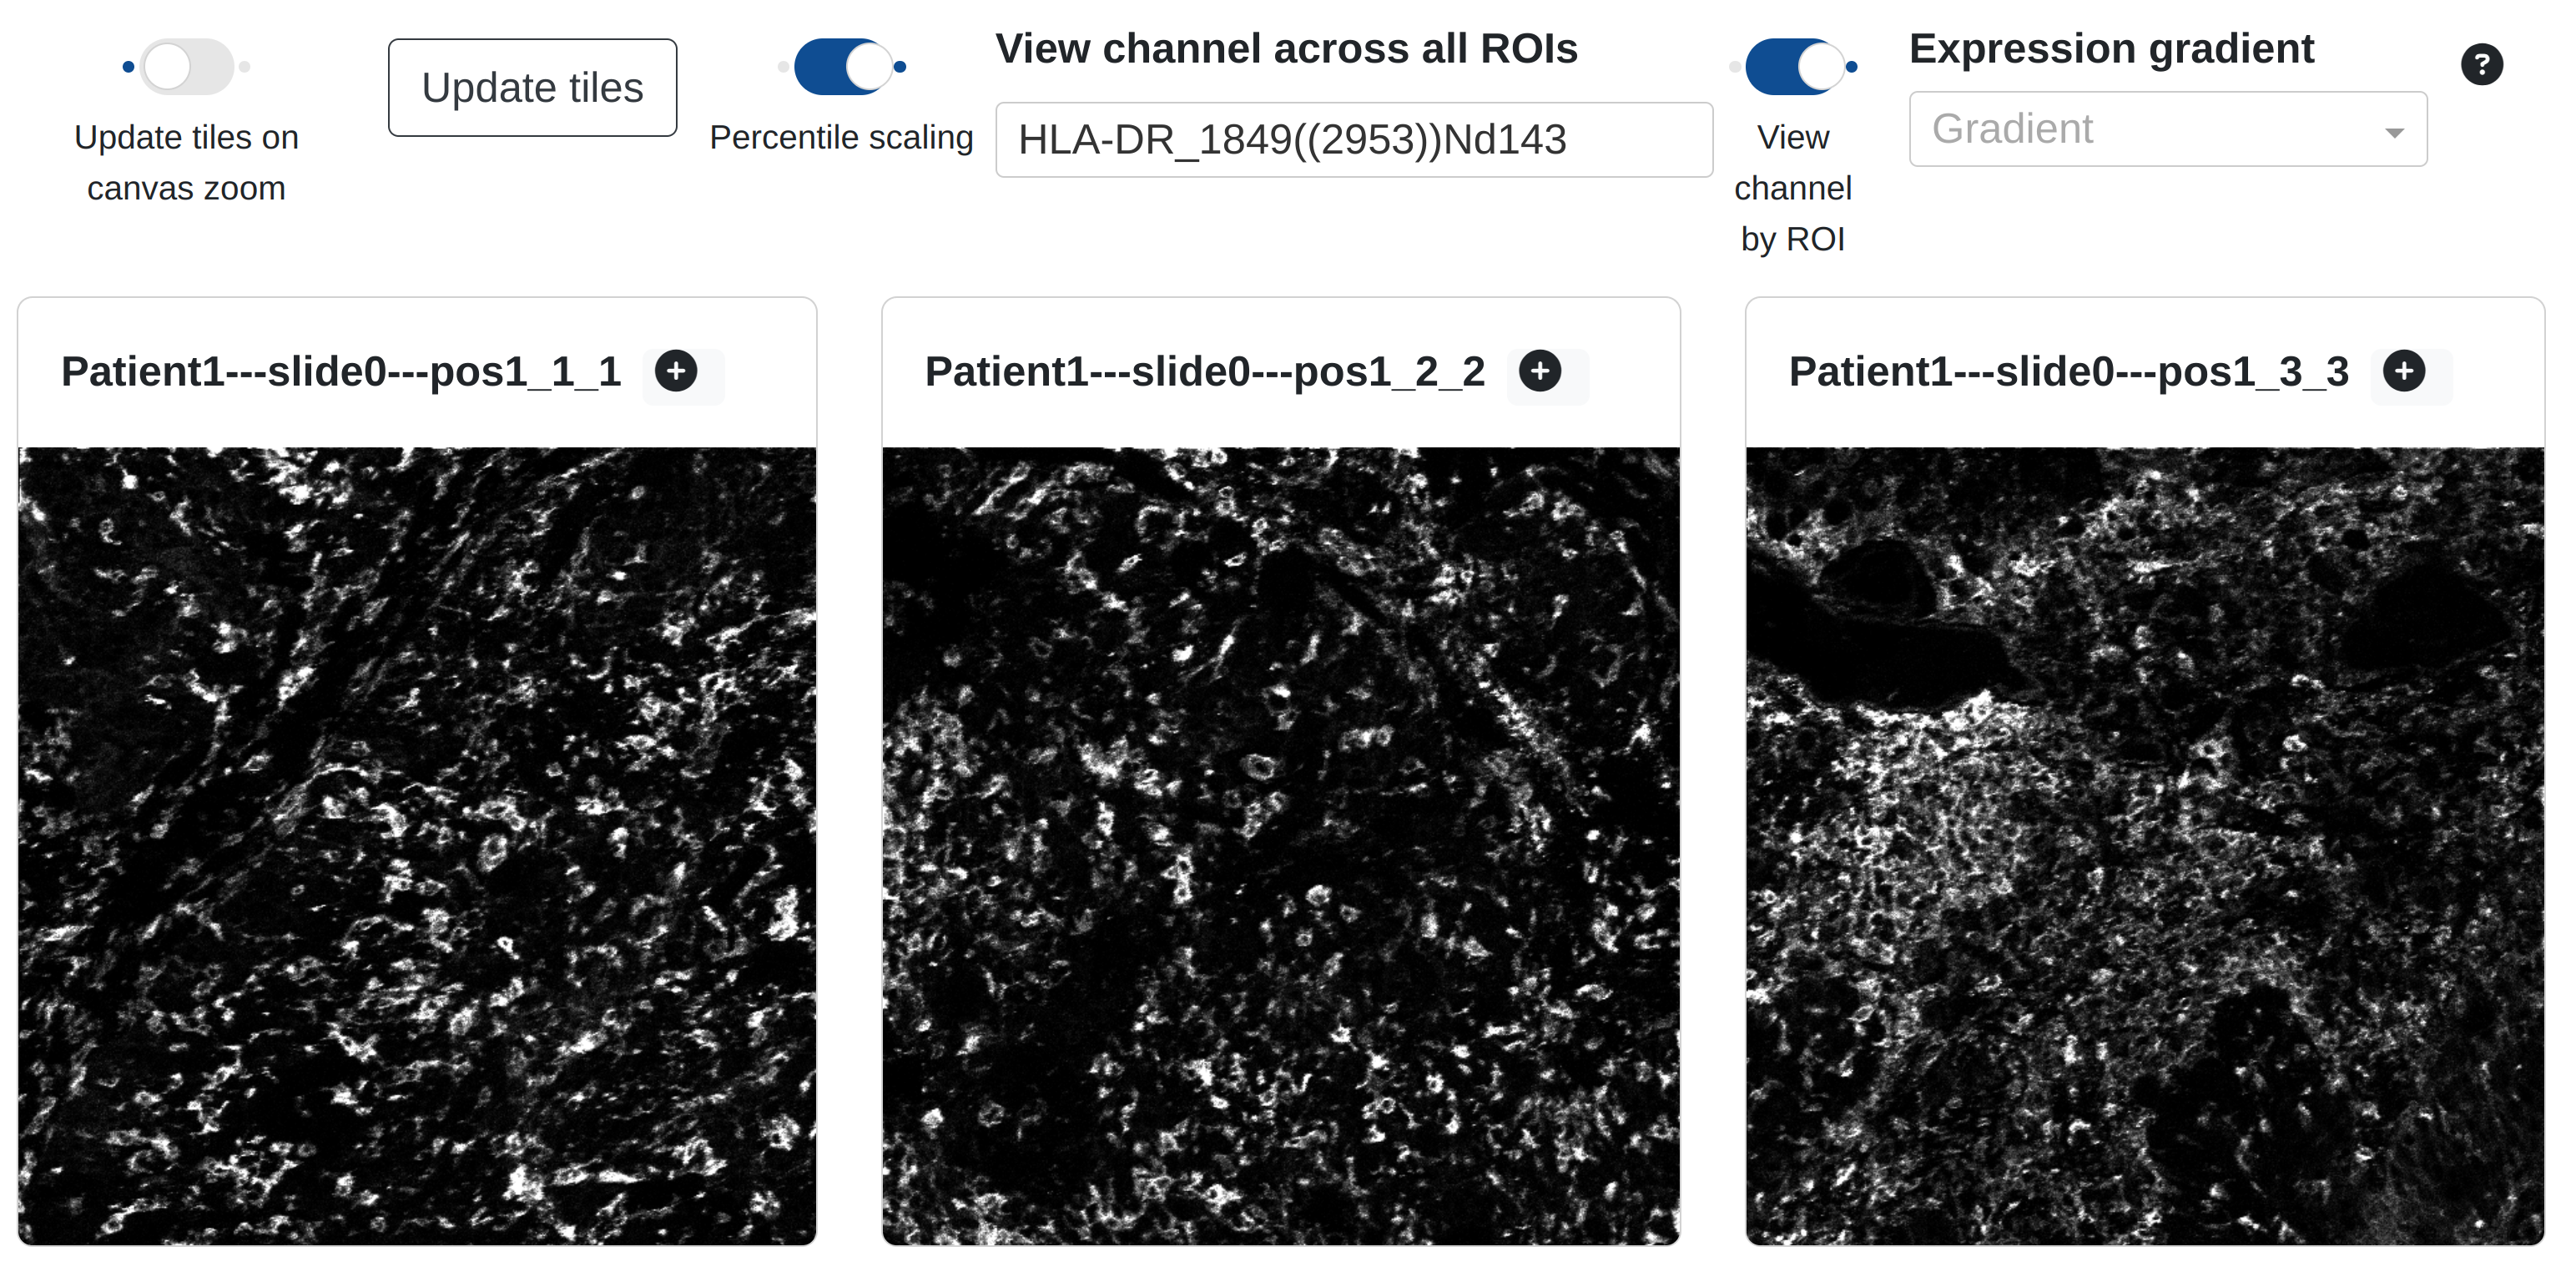
This feature could be slow if the number of imported ROIs is large (> 25+), particularly if the ROIs are held in mcd format.
Channel gallery spectrums
with rakaia v0.22.0, channel gradients can be applied to the channel gallery thumbnails to better assess the gradients of marker expression. Available gradients other than greyscale include rainbow (starting with purple for low expression and going to red for the highest expression) and blue gold(blue for low, gold for high):
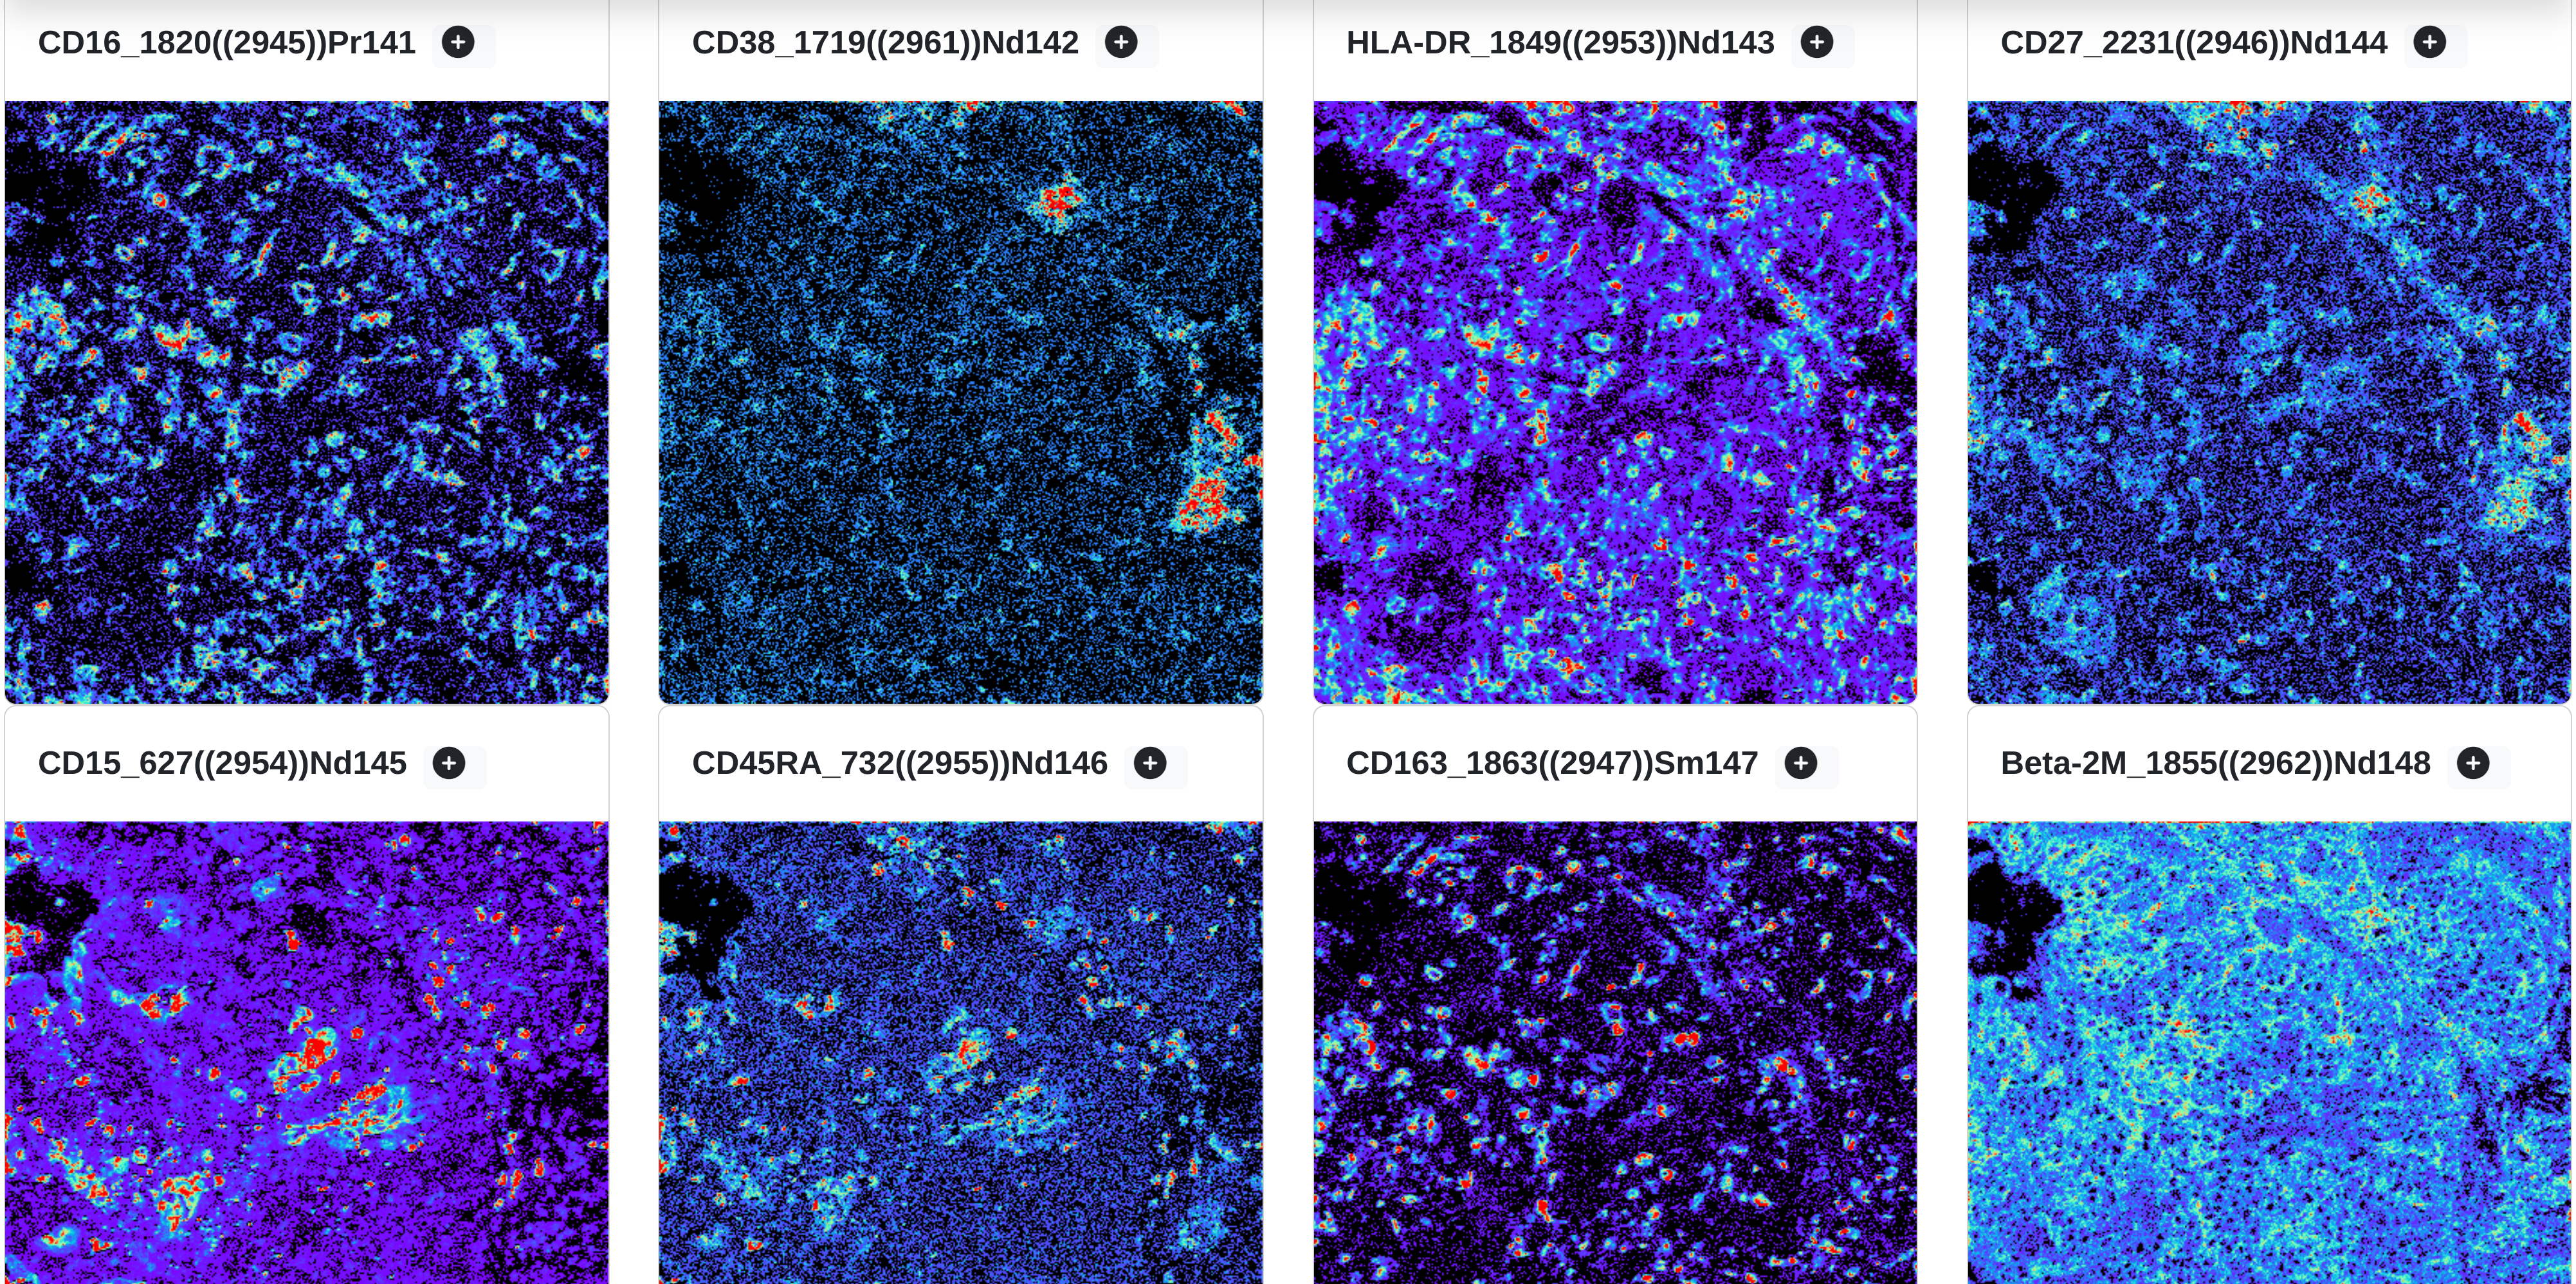
The gradients are compatible with both the ROI and single channel views.