Annotation
rakaia provies a suite of tools and controls to annotate both regions and individual image pixels. These range from drawable shapes to clickpoint annotations, with users having the ability to create multiple annotation categories for multiple annotation types.
Canvas controls
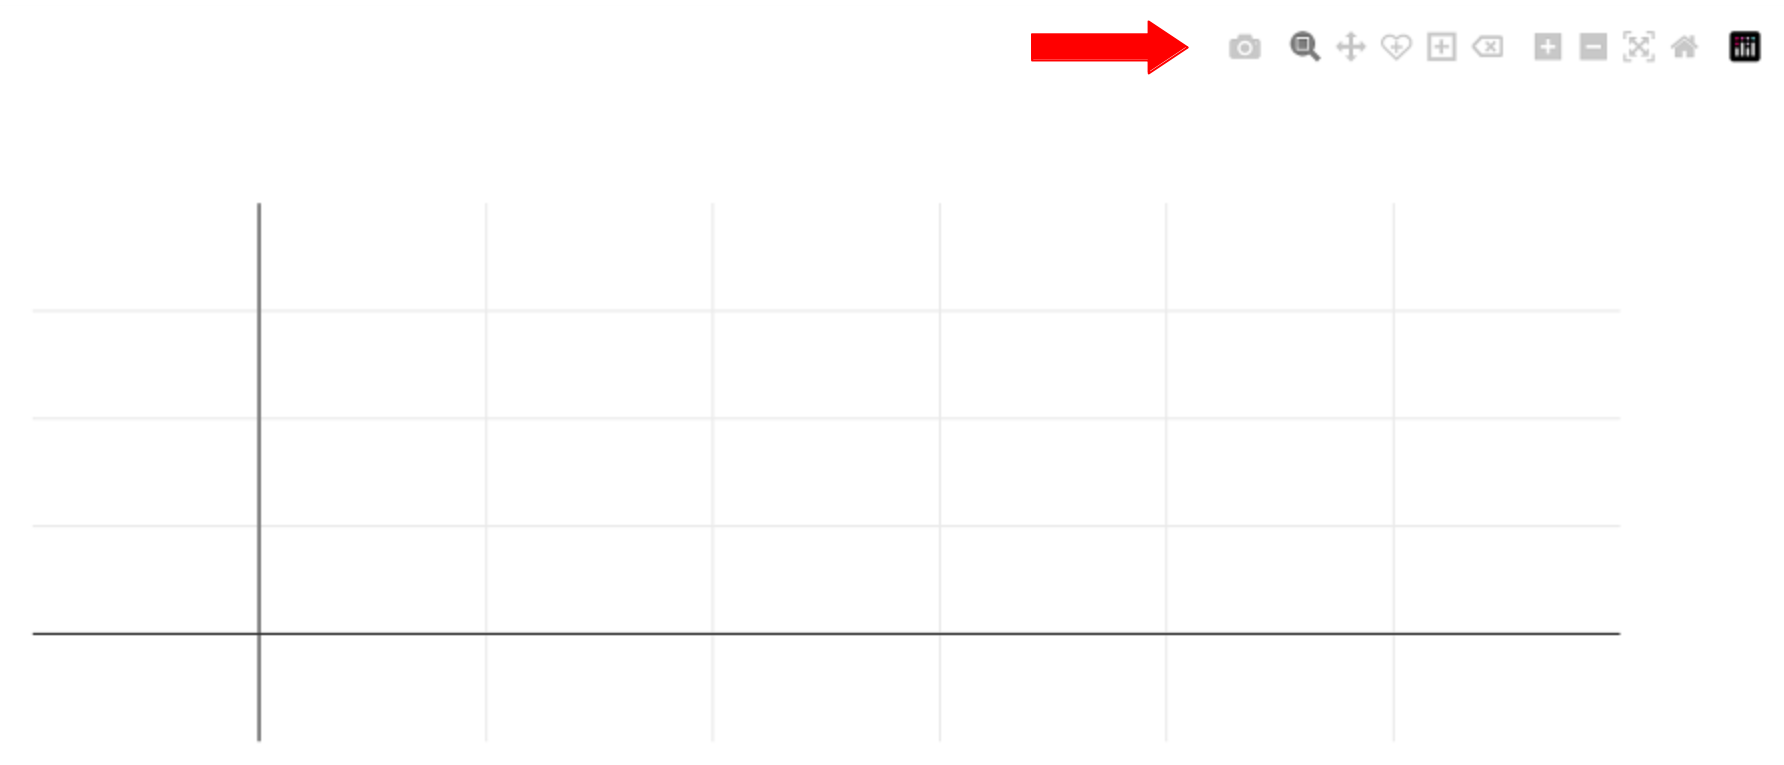
rakaia's canvas component features a toolbar of selectable canvas controls that can either alter the view of the canvas, or produce drawn shapes on the canvas. The toolbar can be invoked by hovering over the canvas with a cursor, after which the toolbar will appear in the top right corner:
Zoom
Canvas zooming is the default mode for canvas interaction. Using the cursor, users can drag into a subset region of the canvas to zoom in on pixels.
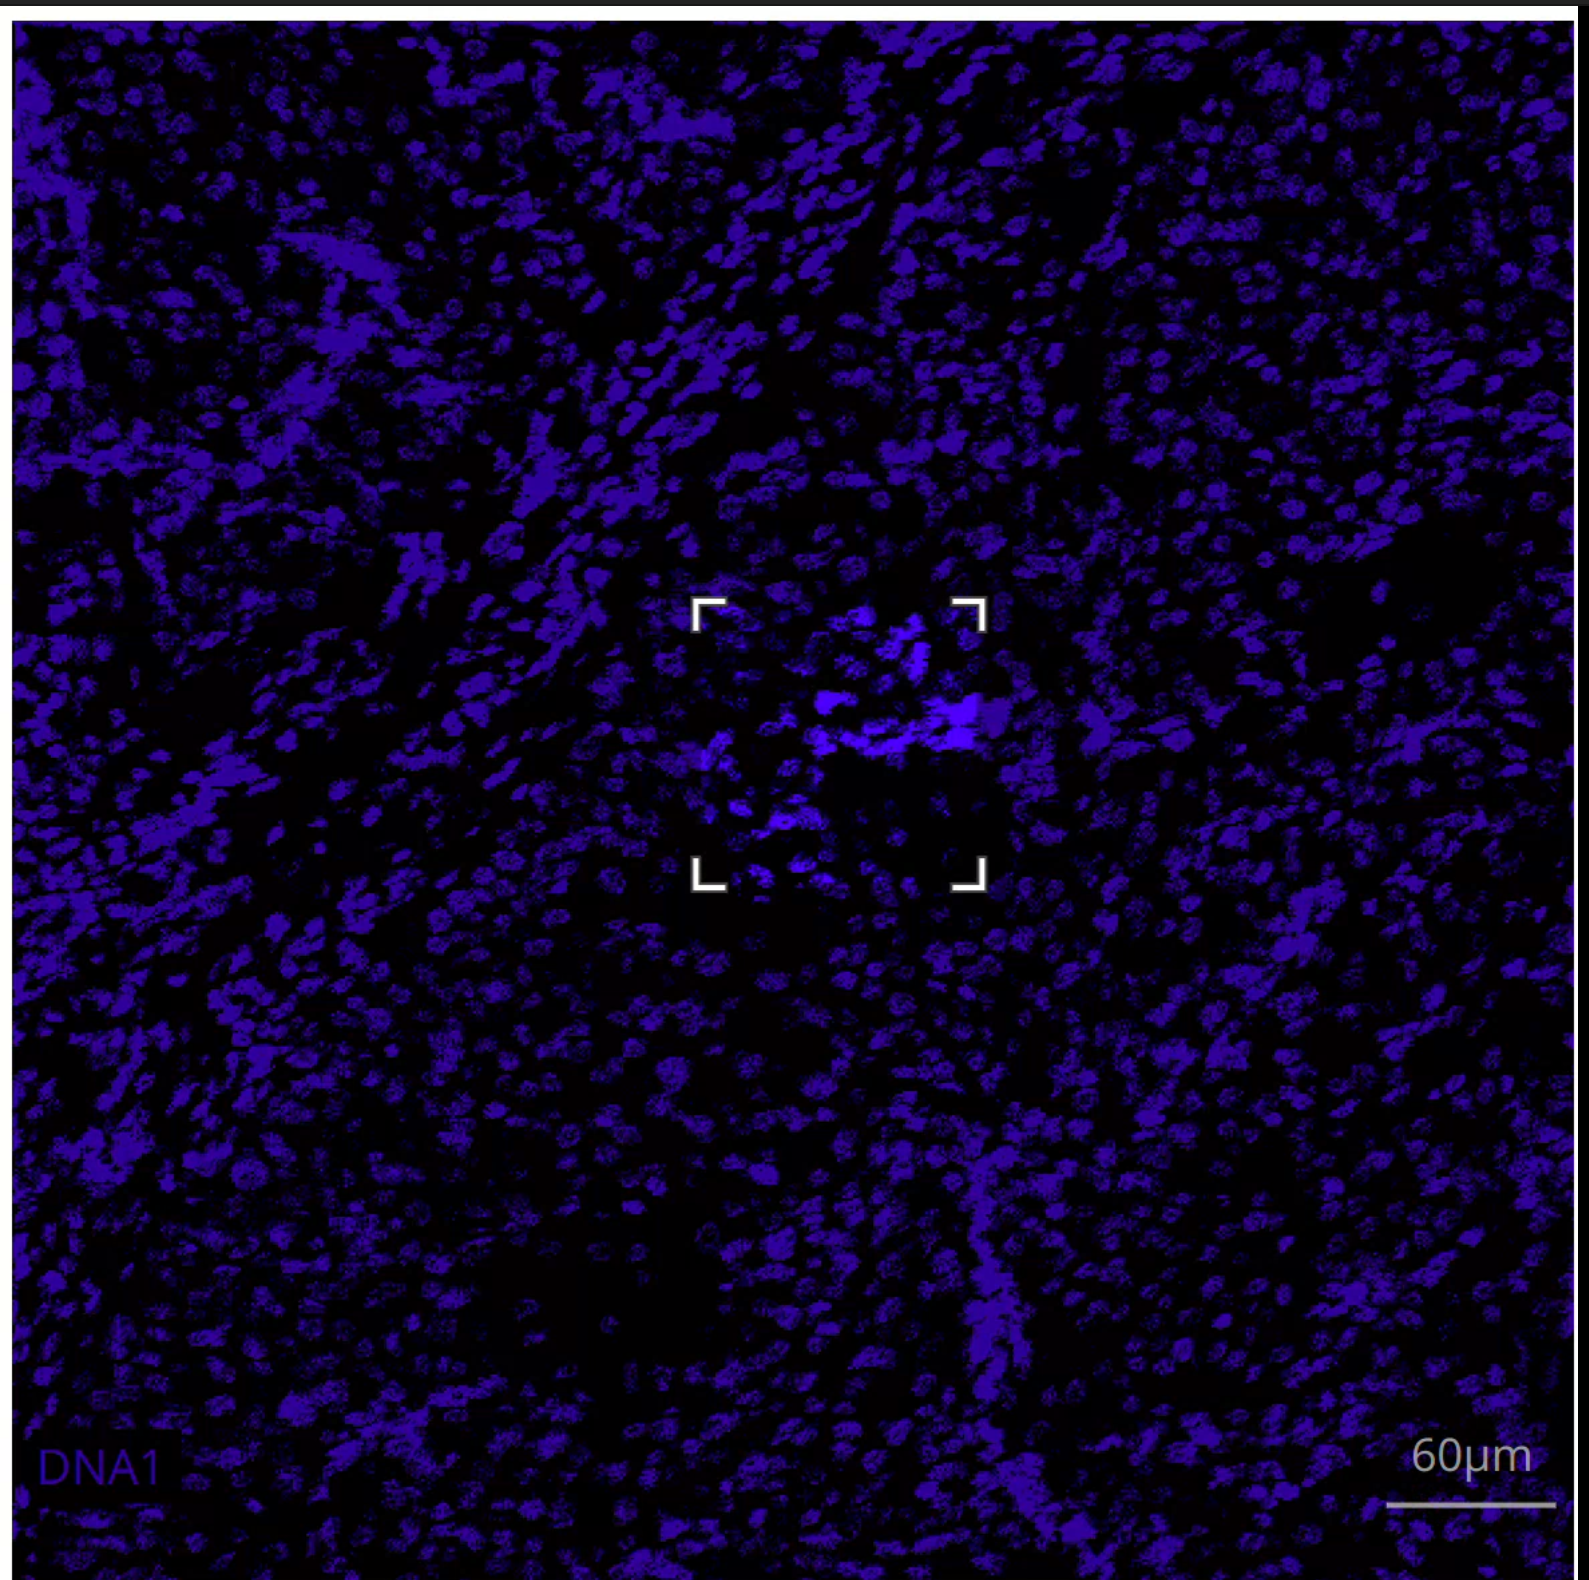
Double clicking on the canvas, or selecting Reset axes from the canvas toolbar will reset the zoom window to the default range.
Using zoom will automatically update the scalebar value to match the number of pixels in the current view. This will work in tandem with setting customized scalebar values; the scalebar length can be changed when zoom has been used and will auto-update the correct value based on the number of pixels that span the viewport.
Pan
Panning allows the user to drag the canvas in different directions while retaining the current zoom level. This can be useful for exploring the pixels immediately adjacent to a zoomed region. Panning in genreal should not be used at the default view level as it is possible to pan off of the image onto the background canvas template.
Shape drawing: Draw closed freeform
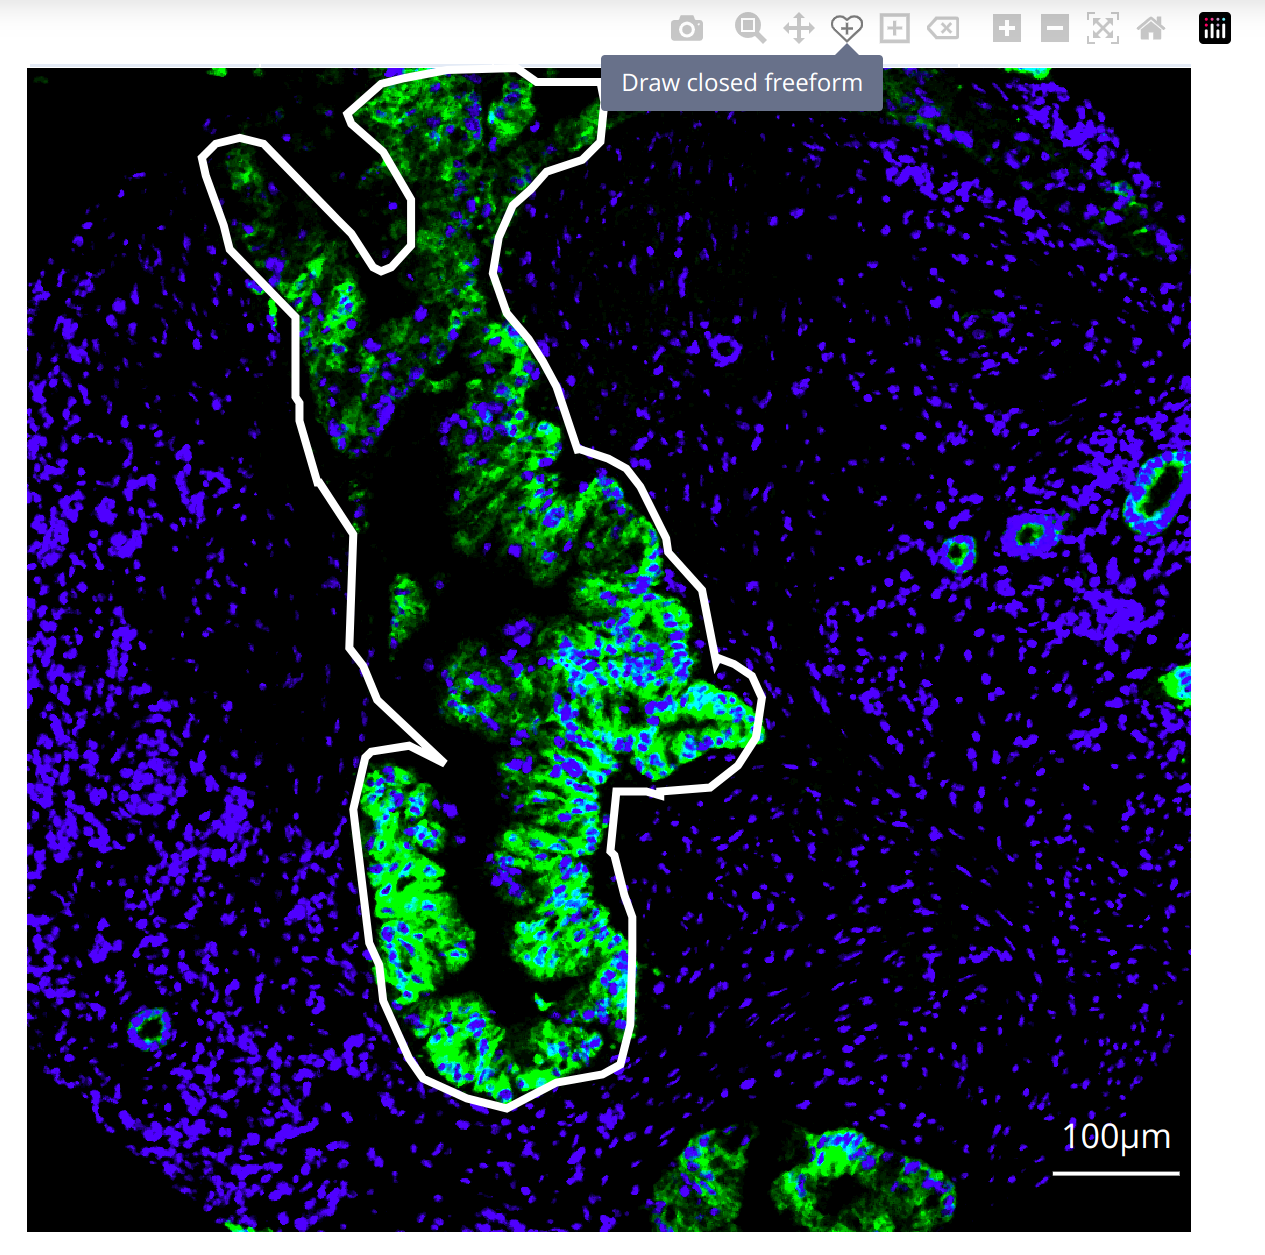
The rakaia canvas supports freehand drawing of enclosed shapes with svgpaths. By selecting Draw closed freeform, users can drag and draw precise shapes around regions of interest:
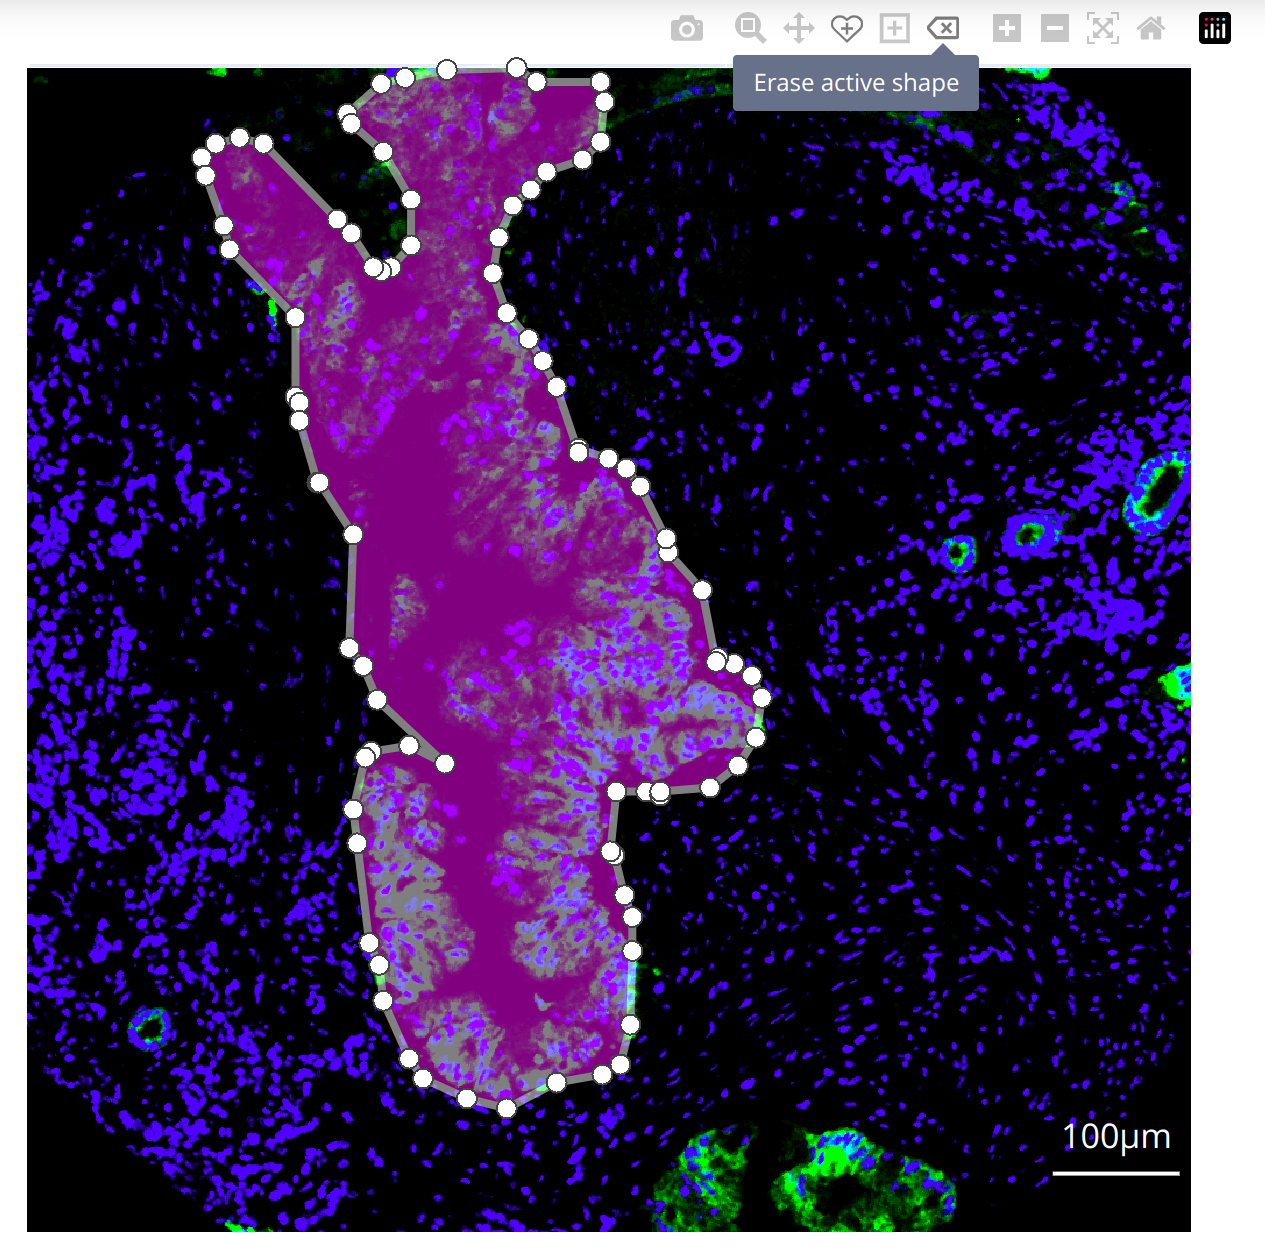
If a shape is drawn incorrectly, users can click the shape so that the interior is filled purple, and the toolbar mode Erase active shape can be selected to remove the shape from the canvas:
Shape drawing: rectangles
Similar to the freeform drawing above, selecting Draw rectangle will allow the cursor to generate a rectanguel shape of varying width and height. The shape here will have similar properties to freeform drawing, ableit with less precision around curved structures. Drawing rectangles is generally discouraged over freeform drawing but can be useful for summarizing rectangular regions and for generating subset thumbnails for PDF export. Removal of rectangular shapes follows the same procedure as freeform shapes.
Region annotations
Region annotations can be created with zooming or drawing rectangles and freeform shapes, and represent the annotation of more than one pixel. If any of the above controls have been use to subset a suitable region, the user may choose to create an annotation for the selected region under Configure, annotate, measure, and more -> Region/Presets -> Add region annotation. Note that this button is only enabled when a region has been detected in the canvas layout that can be annotated. By default, this button is disabled to precent annotation of a blank canvas.
Selecting Region annotation will produce a modal popup with several input categories. Here, users can create and select the annotation category of interest for the current annotation, and can set the following elements of the annotation:
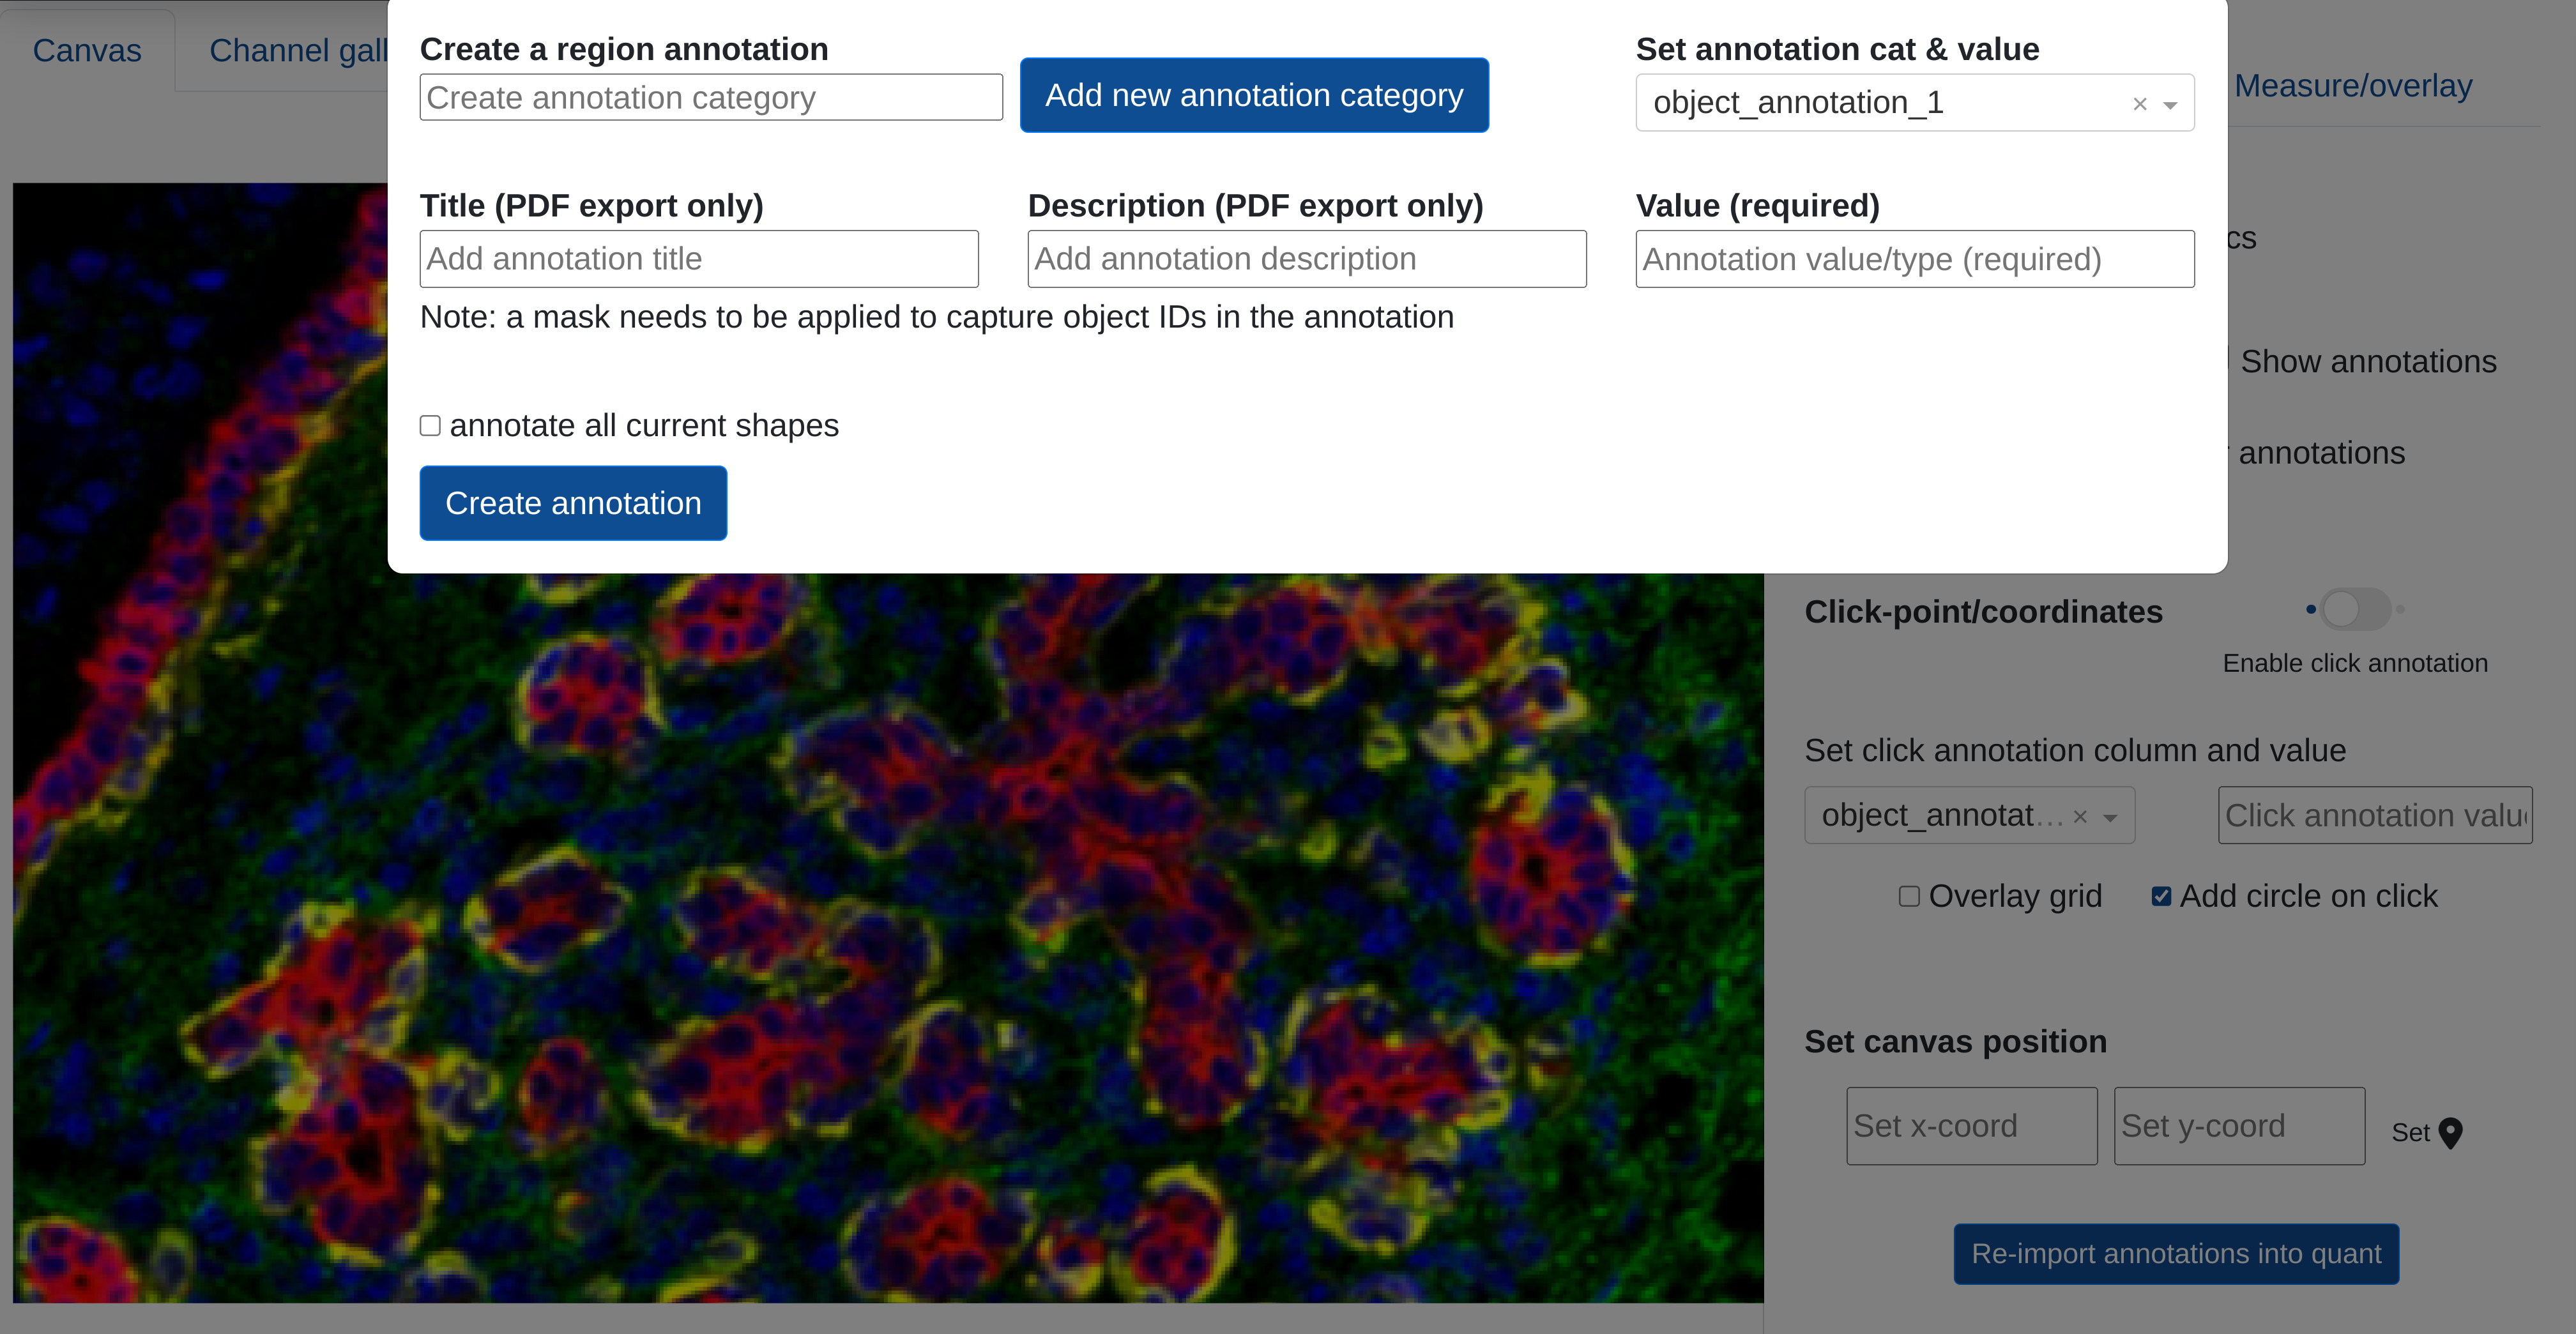
- Region category (required): this produces an annotation grouping where different annotation values can be passed. It is equivalent to a column name in a table descriving different region annotations. This field is required, and it provided as
object_annotation_1by default - Annotation value (required): This is the value given to the particular annotation in the category, and would be equivalent to filling in a cell in a column with the region category above. This field is also required
- Region title and description (optional): if outputting to PDF, the region title and description can be used to describe the region and incude relevant information that can be shared in an external document. The description is designed to be a longer text statement on the annotation than what can be captured in the annotation value. Note that these appear only in PDF outputs.
Users should then finish creating the annotation by clicking Create annotation.
When users create annotations, rakaia will attempt to find suitable coordinate lists that describe the region. For either zoom and rectangular regions, the coordinate list will consist of min and max values for both the x and y axis; if a freeform path is drawn, rakaia will extract the boundary pixels from the svgpath and compute the pixel positions on the interior of the shape. These positions are then used to generate custom masks or lists of segmented objects within regions (See below under Annotation outputs).
Saving object ids in a region annotation
If a user has a mask applied to the canvas and toggled on, drawing a freeform shape around a region allows the user to capture the object ids from the mask contained within the region. This is useful for generating custom ID lists for object associated with regions.
Clickpoint annotations
Clickpoint annotations are annotations for single pixels represented by an x and y coordinate. Generation and export of clickpoint annotations differ from regions in that coordinate lists are not generated for a single combination of x and y positions. Therefore, rakaia stores click point annotations in a different format.
Users can enable clickpoint annotation under Configure, annotate, measure, and more -> Region/Presets -> Click annotation. Under Add cell type for click, the specified annotation for individual pixels should be completed. Users can then single click on any position on the canvas, and an annotation at that xy coordinate position will be generated:
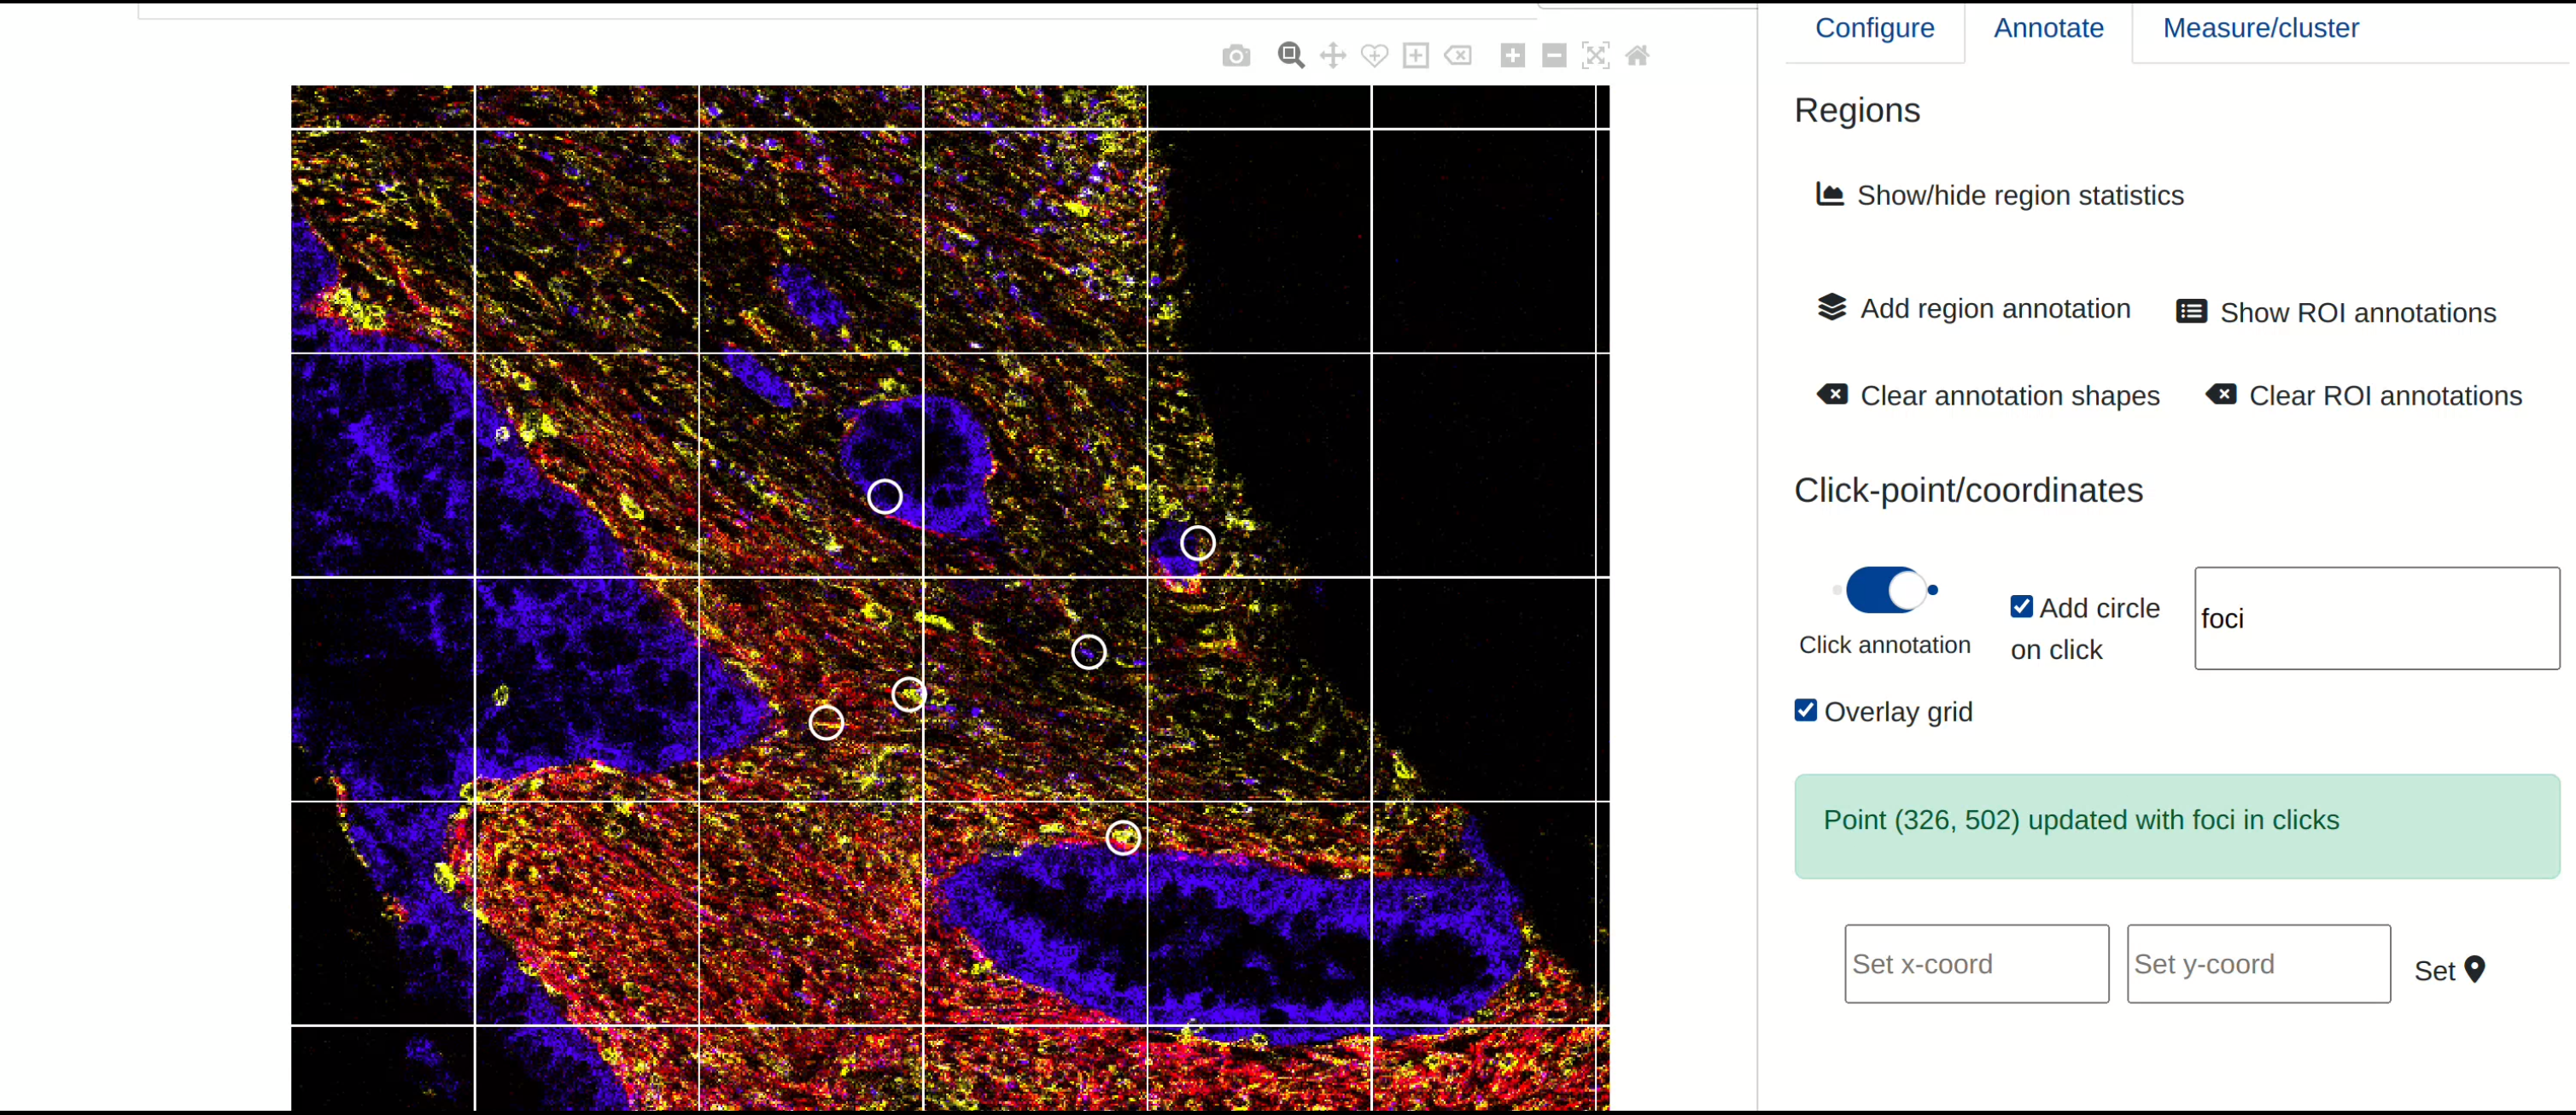
Note: It is very important for users to disable the click annotation once annotations are complete. Failure to do so could result in logging downstream click events generated by the user during other methods of canvas interaction, including other types of annotations.
Users can choose to include a small circle drawn around the spot of annotation (enabled by default). This will use the xy coordinate as the centroid for the circle, and allows the user to track which pixels have already been annotated. These circles may overlap, and their radius can be set under Set additional session variables in the top right corner of the application window.
Annotation outputs
rakaia offers a variety of output formats for annotations, depending on the type of annotation and the information geing extracted from the session.
Buttons for annotation outputs can be found under Configure, annotate, measure, and more -> Region/Presets at the bottom of the tab in the collapsible panel.
PDF
PDF exports consist of a single page per region annotation (excludes point clicks) that consists of a thumbnail of the canvas region selected, with the current session blend parameters applied. Ths thumbnail will have the user-given title and description provided above and below the thumbnail, respectively, as well as a legend of the channel colours and the region bounds, as a scalebar is not generated int he PDF thumbnail.
PDF exports are best suited for descriptive annotations of specific regions that can be shared externally.
Mask tiffs (.zip)
Region annotations can be output as tiff masks with corresponding lists that link object IDs to user annotations. For each annotation category that a user generates, one tiff will be produced that acts as the mask for the objects associated with that category. Some examples are shown below:
- Example 1: User 1 creates an annotation category named
qcwith three annotation cell types:good,bad,unknown. On export, one tiff file namedqc.tiffis produced, and the array contains 3 values, one for each of the annotation cell types. In the matchingqc.jsonfile, the contents will help to match the id to the category:
{1: good, 2: bad, 3: unknown}
- Example 2: User 2 create two annotation categories named
healthyandmalignant, corresponding to tissue types. In each of those categories, the user makes two annotation cell types:positiveandnegative. The user also used an existing mask to annotate cells calledroi_1. On export, there will now be two tiffs,roi_1_healthy.tiffandroi_1_malignant.tiff, both of which have two values for the positive and negative types. Since an existing mask was used, the original mask name is appended to the start of the exported masks.
Region CSV
The region CSV export will output a list of any object IDs that are contained within region annotations that are generated when a mask is applied during annotation. The main function of the CSV export is to provide a list of mask IDs that can then be matched downstream to either segmentation masks or clustering results. The CSV will contain the ROI name, name of the mask used, object ID, and its annotation category and type as input by the user.
Clickpoint CSV
Click annotations are exported from rakaia separate from region annotations as they do not depend on the presence of a mask during generation. The click annotation CSV will contain the ROI name, x and y-coordinates of each annotation, and annotation category and type as input by the user.
Region summary statistics
For any of the region annotations specified above, rakaia can provide a tabular summary of expression statistics for every channel currently applied to the canvas. For a current zoom configuration, a single region will be computed, but for every shape drawn on the canvas, the summary statistics will be written per region. Region summary statistics can be found in the additional canvas tool panel under Annotation -> Regions -> Show/hide region statistics (this selection will open the dropdown table that is closed by default). As an example, below is a summary statistics table for a series of drawn shapes for three channels. The regions are ordered by the order in which the shapes are drawn:
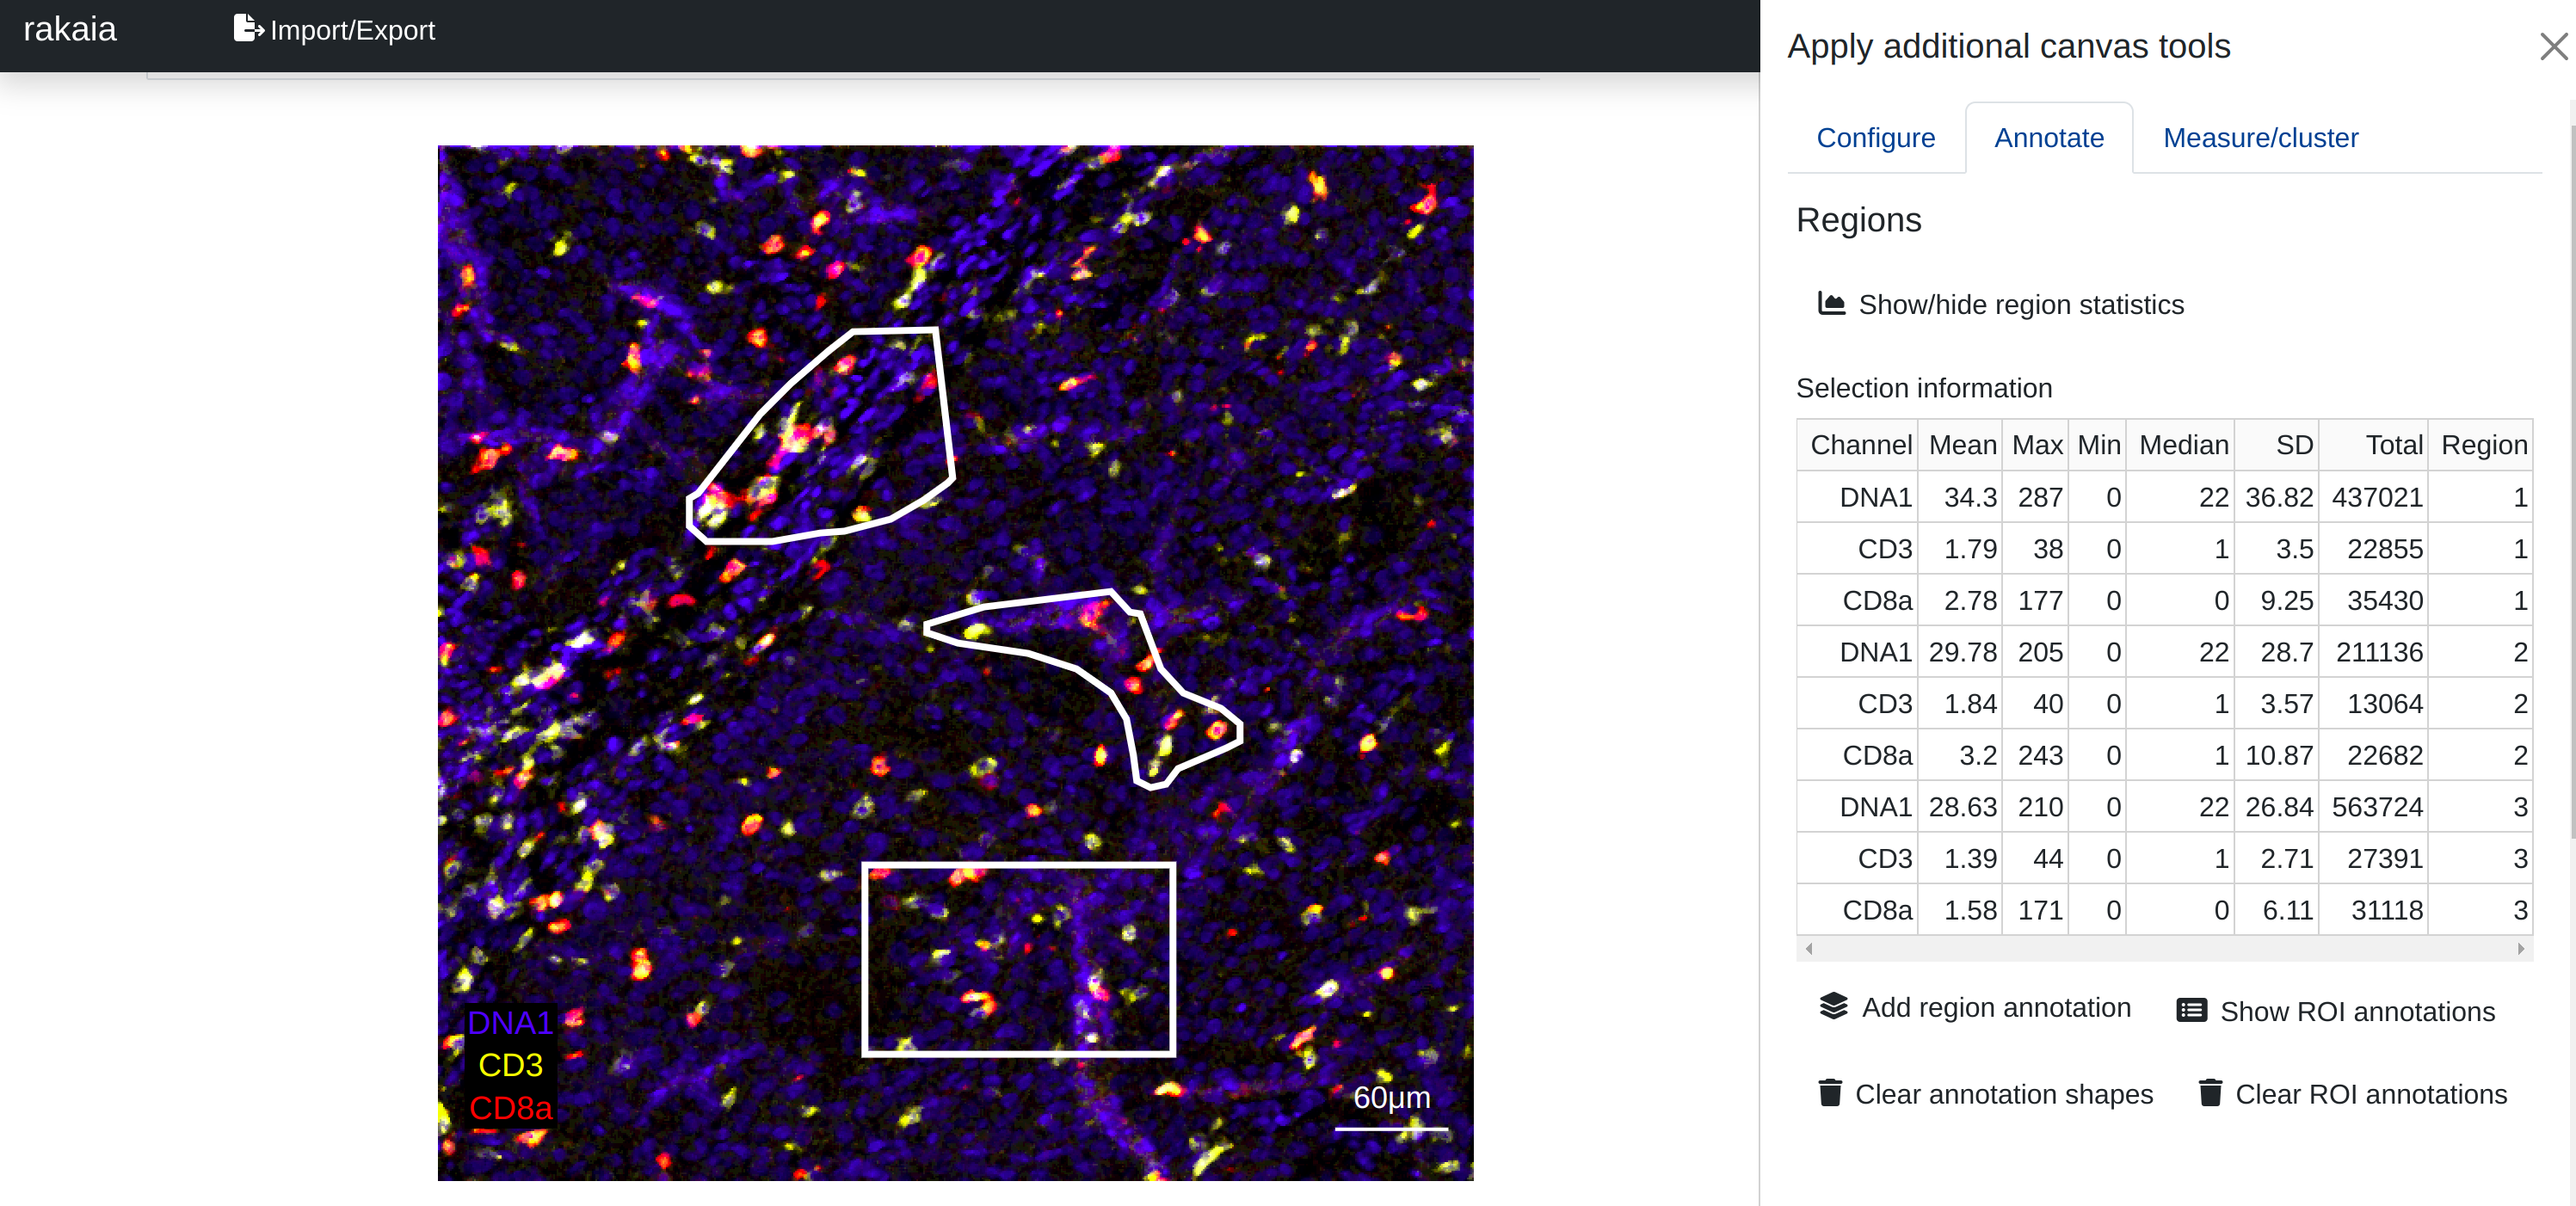
Canvas shapes can be selected and moved around the canvas or deleted, and these updates will be propogated to the region summary table. Shapes can be propogated across ROIs provided that the dimensions remain the same, and the statistics will update for the new image arrays. This can be useful for measuring region expression across serial sections, for example.
Hot pixel detection (hpf)
As of rakaia v0.22.0, channel summary statistics include hpf values for each channel per region. The values attempt to emulate the computations used by the steinbock pipeline by computing the maximum raw signal difference within a region based on 8-pixel neighborhood tiles. So, for example, a hpf value for channel 1 of 10 in region 1 means that within region one for channel 1, the greatest observed difference in pixel intensities between a pixel and its 8 neighbours was 10. hpf values can be used to suggest hpf values to be passed back to the steinbock snakemake pipeline for reprocessing.